BAM File Quality Control
Introduction
This tool evaluates RNA-Seq alignment files using the R package RSeQC. RSeQC provides modules that inspect sequence quality, nucleotide composition bias, PCR bias, and GC bias. The RNA-Seq specific modules assess sequencing saturation, mapped read distribution, coverage uniformity, strand specificity, transcript-level RNA integrity, and more.
Please cite RSeQC and Samtools as:
- Wang L., Wang S. and Li W. (2012). RSeQC: quality control of RNA-seq experiments. Bioinformatics (Oxford, England), 28(16), 2184-5.
- Li H., Handsaker B., Wysoker A., Fennell T., Ruan J., Homer N., Marth G., Abecasis G. and Durbin R. (2009). The Sequence Alignment and Map format and SAMtools. Bioinformatics (Oxford, England), 25(16), 2078-9.
Run BAM quality control for RNA-Seq alignment data
This tool is available in the Transcriptomics module under Bam File Quality Control. The wizard accepts one or more input BAM files, an optional BED, GFF, or GTF reference, and several parameters that depend on the input data (Figure 1 and Figure 2).
Input
Aligned RNA-Seq short-reads in BAM format (single or paired-end) can be provided as input.
Configuration
- Gene Models
A BED file with gene models can be provided. It must match the version of the reference genome used in the previous mapping step. Chromosome names must match, and the BED file is expected to have 12 tab-separated columns.
Providing a BED file is optional but recommended, because many statistics and plots are not available without it. - Minimum Mapping Quality
Set the minimum mapping quality (Phred-scaled) for an alignment to be considered "uniquely mapped". - Read Alignment Length
Set this to the original read length. For example, all these cigar strings ("101M", "68M140N33M", "53M1D48M") suggest the read alignment length is 101. - Read Sample Rate
Number of aligned reads used to calculate the mismatch and deletion profiles. The default value is 1000000. - Minimum Intron Length
Minimum intron length in base pairs. The default value is 50. - Min Reads for Junction Calls
Minimum number of supporting reads required to call a junction. The default value is 1.
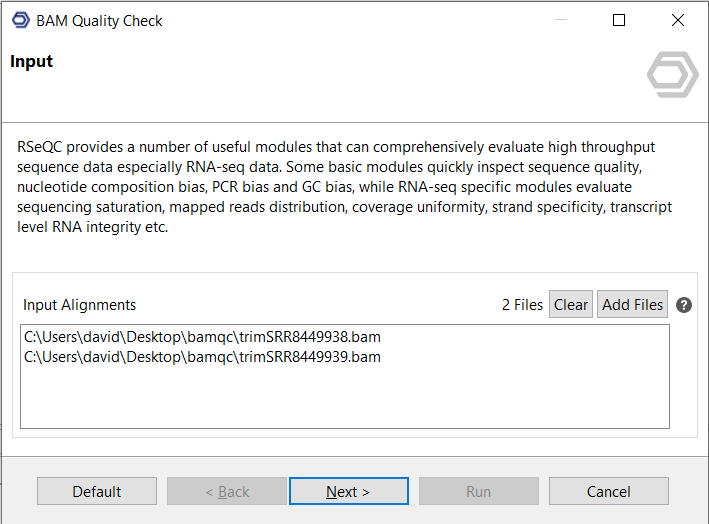
Figure 1. Input page.
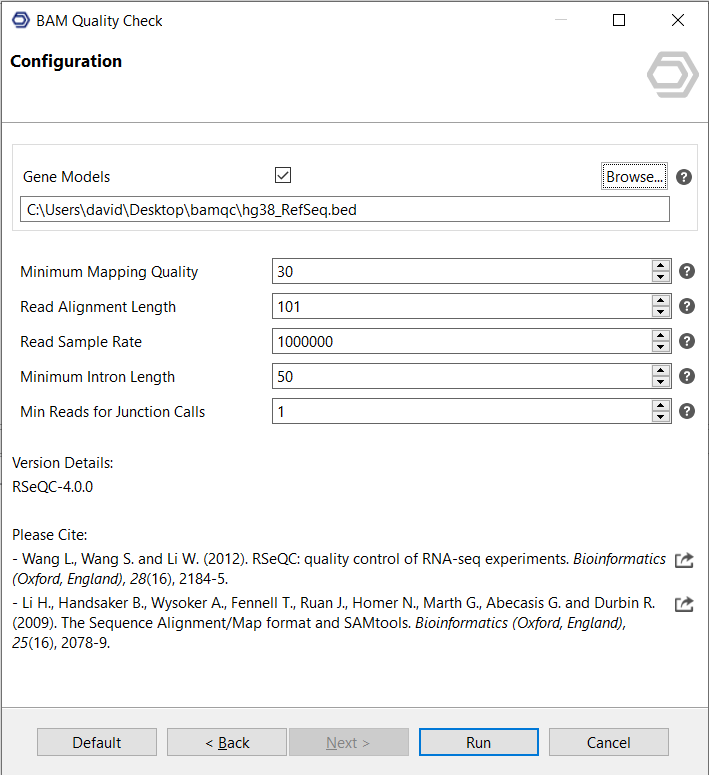
Figure 2. Configuration page.
Results
- Table with summary information for all analyzed samples (Figure 4).
- Report with detailed information for each sample (Figure 3).
- Charts available from the main table side panel.
Charts
The side panel of the results table (Figure 4) provides action buttons for different chart categories. Some examples are shown below.
- General Charts
These charts are related to general characteristics. - Annotation Based Charts
These charts are related to the distance of Full Splice Match (FSM) and Incomplete Splice Match (ISM) transcripts to annotated Transcription Start Sites (TSS) and Transcription Termination Sites (TTS).
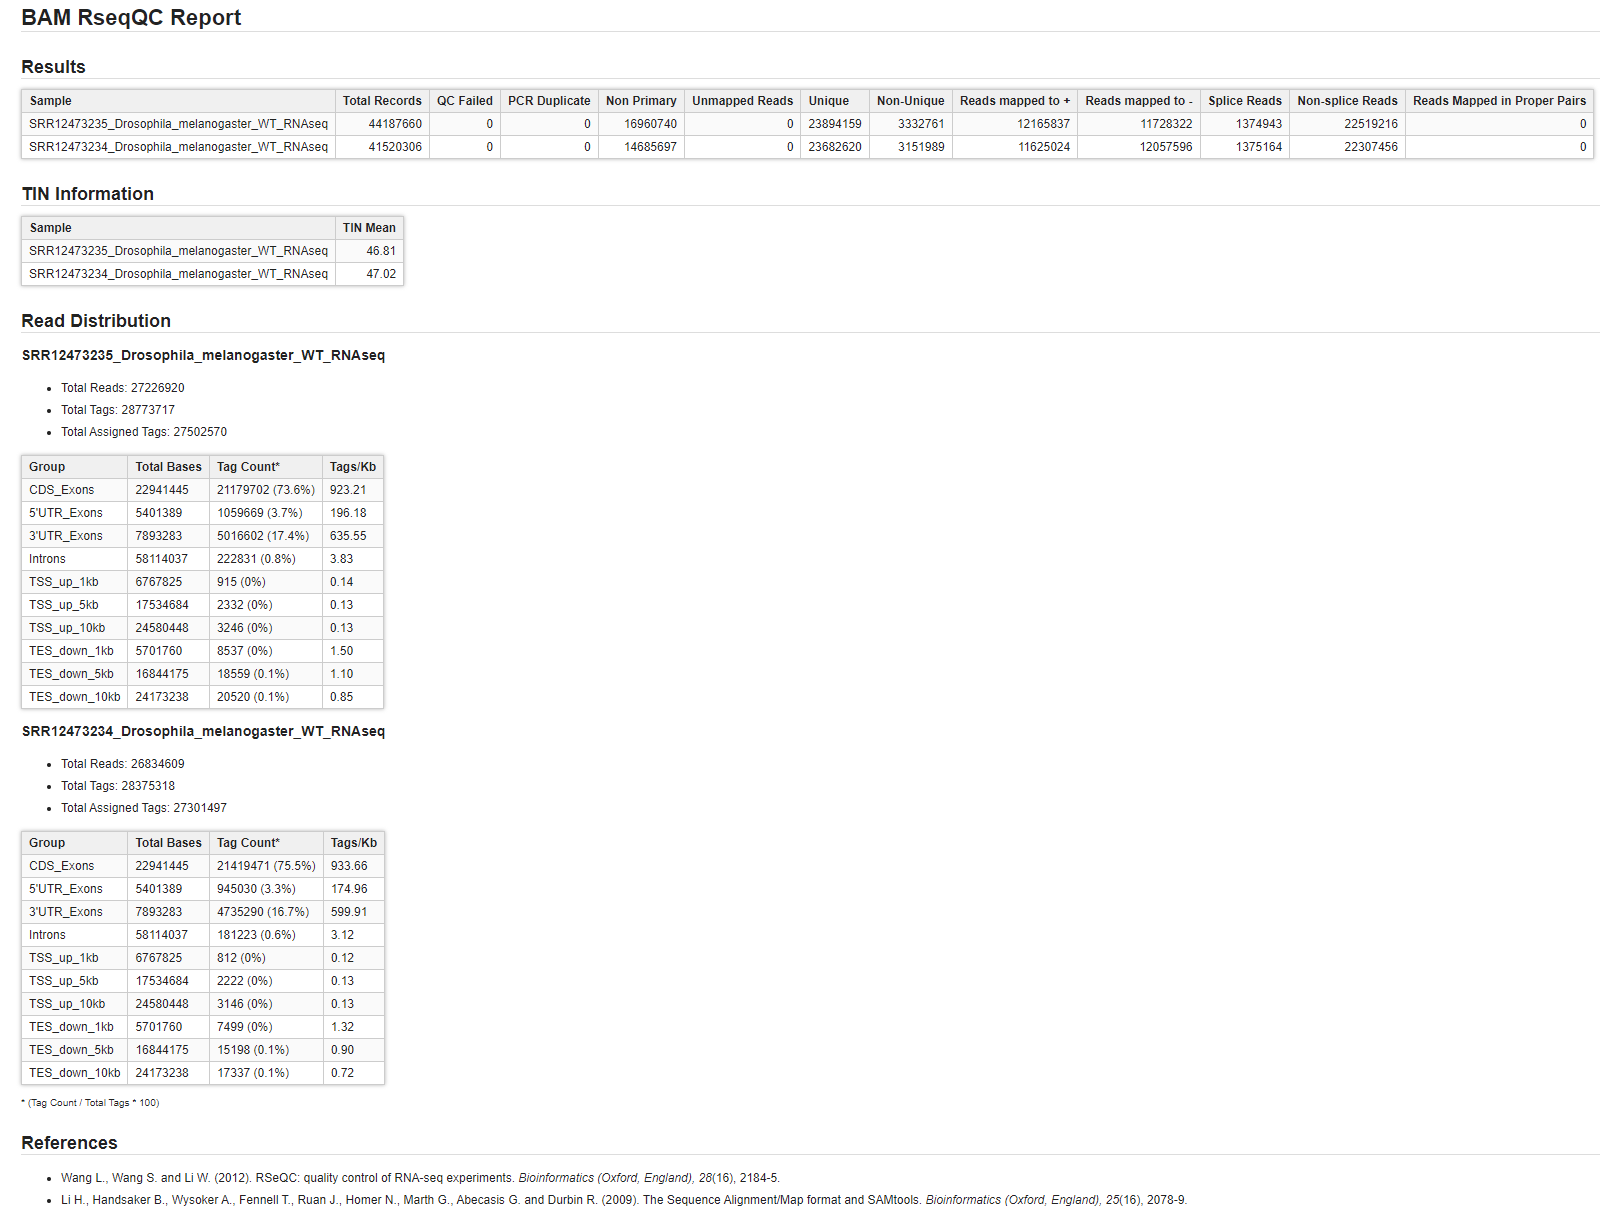
Figure 3. Report page.
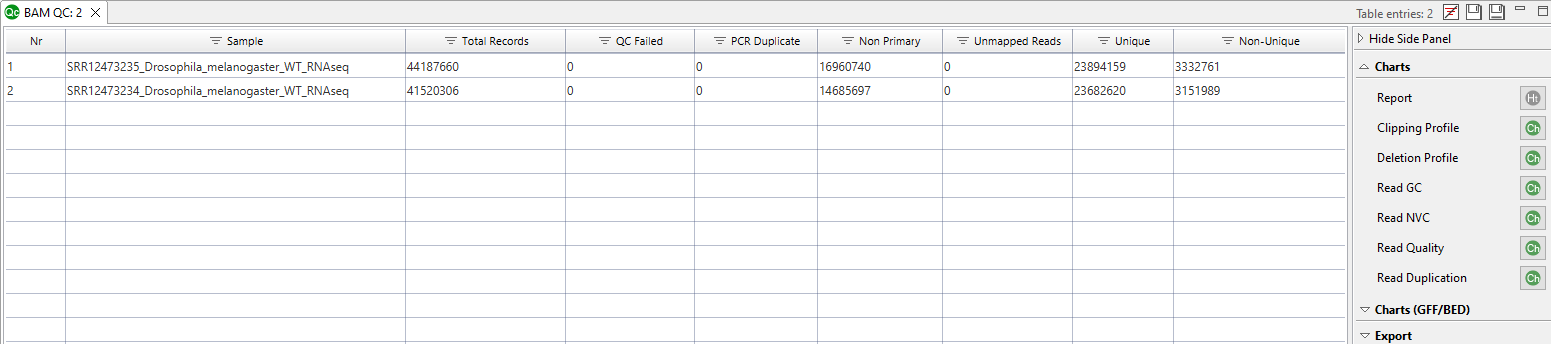
Figure 4. Results table.
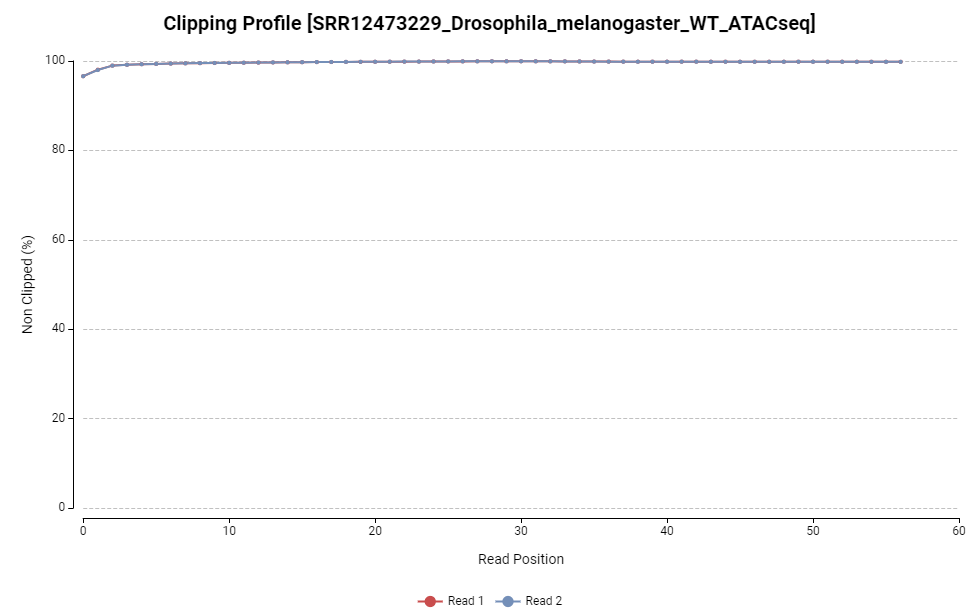
Figure 5. Clipping profile chart.
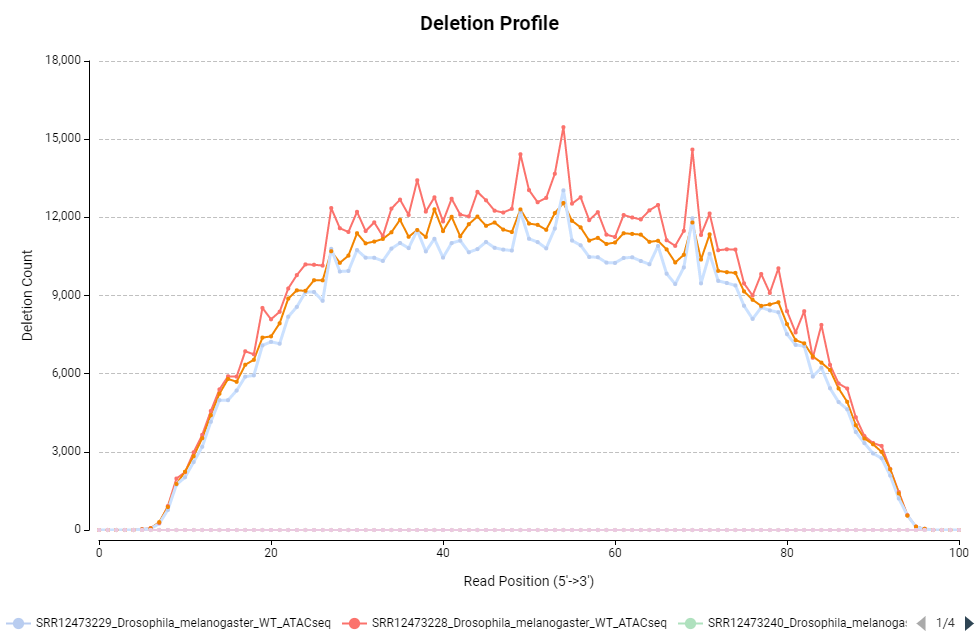
Figure 6. Deletion profile chart.
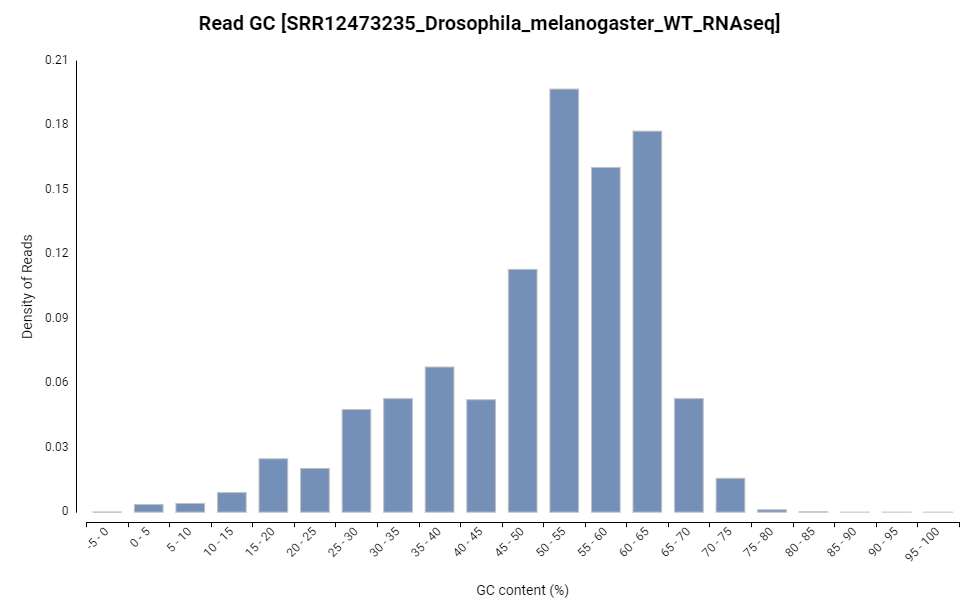
Figure 7. Read GC content distribution chart.
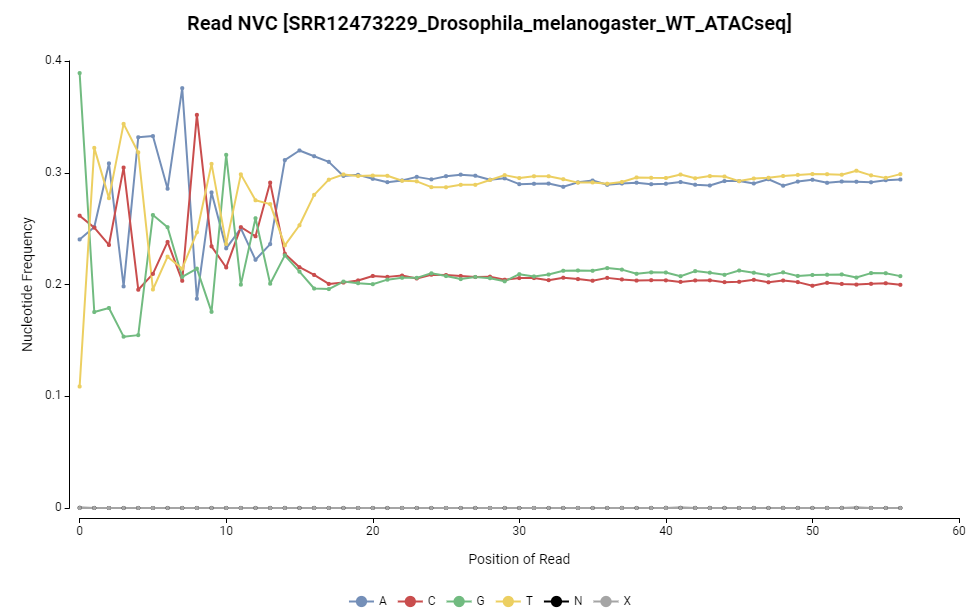
Figure 8. Read NVC distribution.
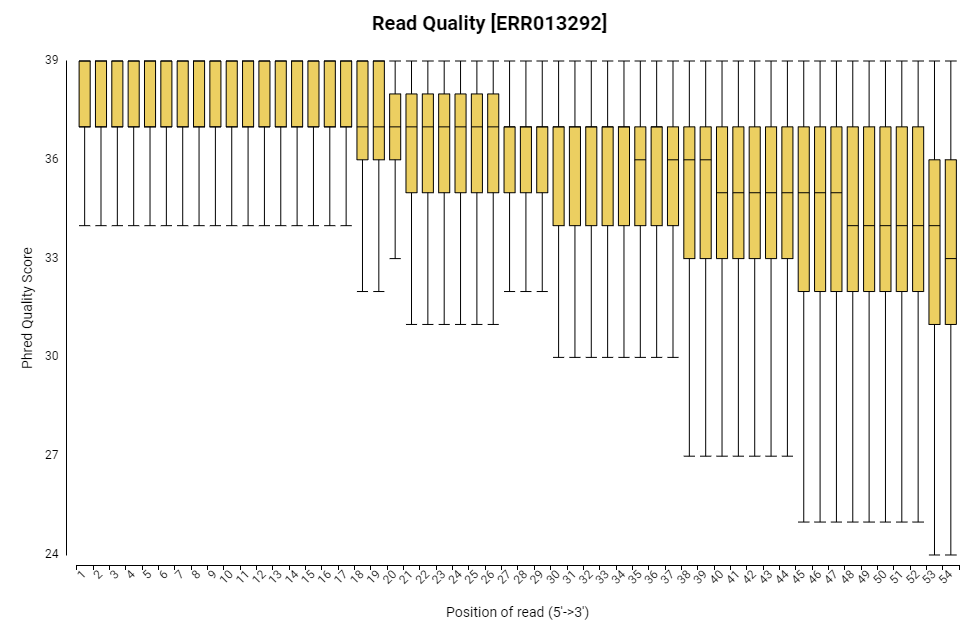
Figure 9. Read quality chart.
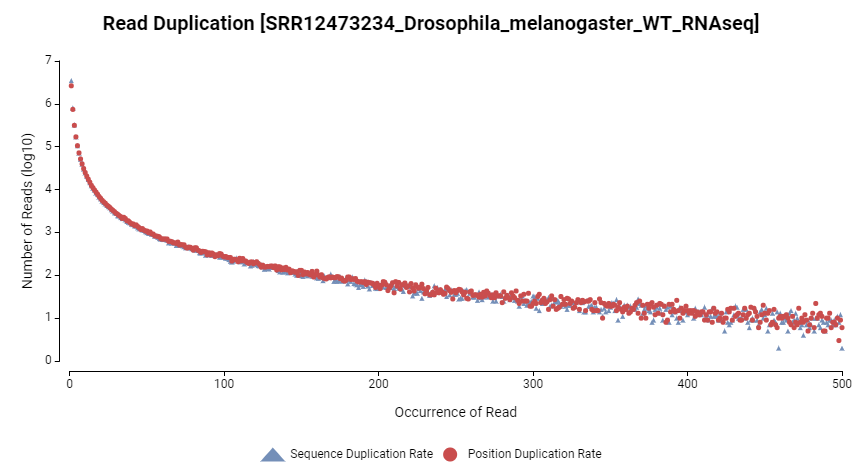
Figure 10. Read duplication rate.
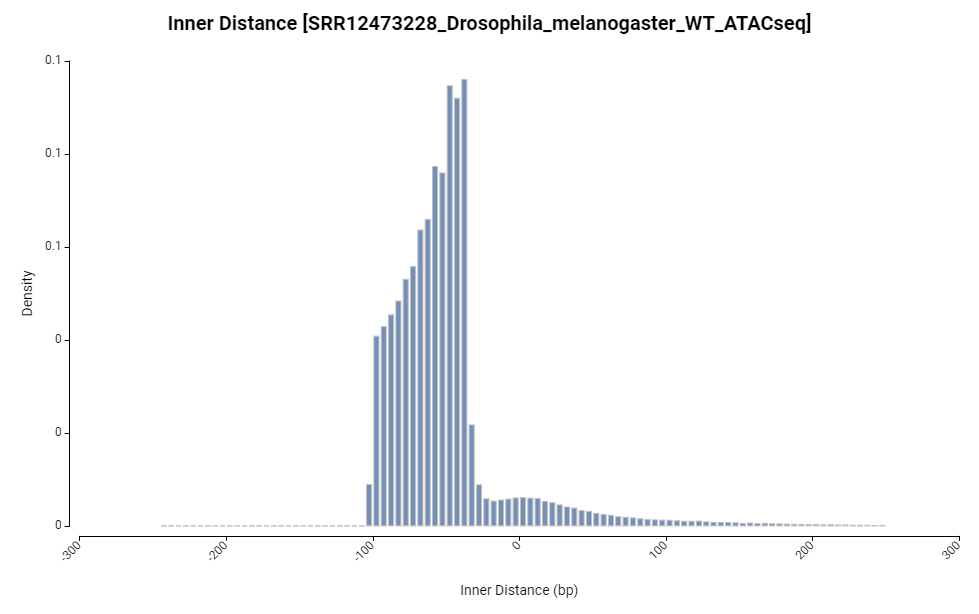
Figure 11. Inner distance chart.

Figure 12. Junction annotation pie chart.
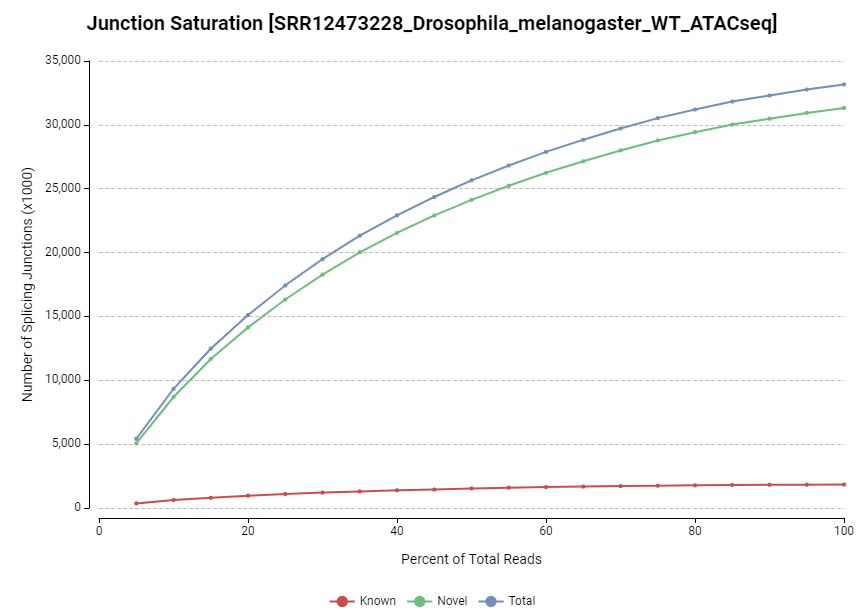
Figure 13. Junction saturation chart.
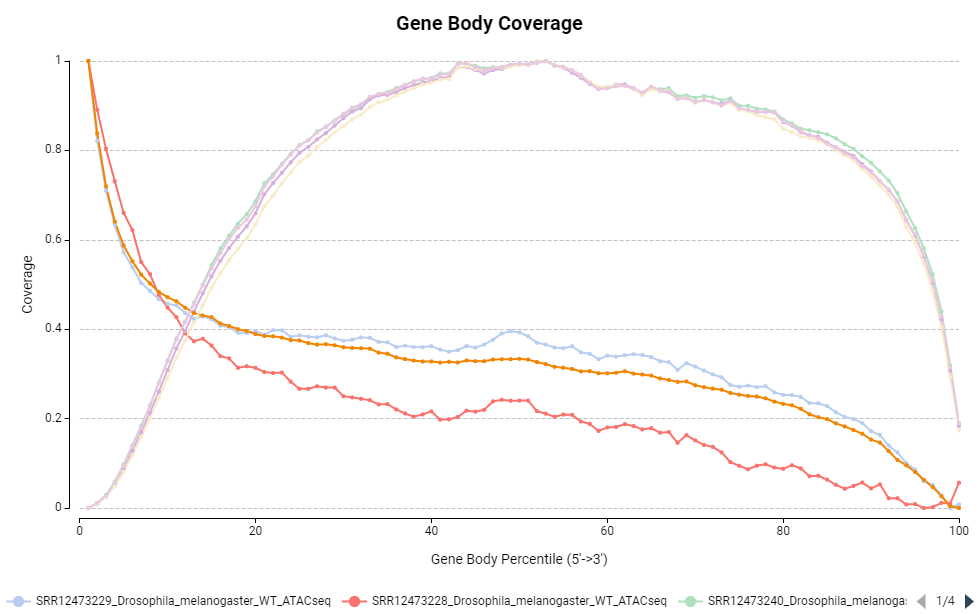
Figure 14. Gene body coverage distribution.