Gene Ontology Annotation
Introduction
Annotation is the process of selecting GO terms from the pool obtained in the GO Mapping step and assigning them to the query sequences. It is the third and final step of the Blast2GO methodology.
GO annotation is carried out by applying an annotation rule (AR) to the found ontology terms. The rule seeks the most specific annotations with a certain level of reliability, and is adjustable in specificity and stringency.
For each candidate GO an annotation score (AS) is computed as the sum of two terms. The first, direct term (DT), represents the highest hit similarity of the GO, weighted by a factor corresponding to its evidence code (EC). The second term (AT) provides the possibility of abstraction: it is an annotation to a parent node when several child nodes are present in the candidate collection. It multiplies the number of GO terms unified at the node by a user-defined GO weight that controls the strength of abstraction. When the GO weight is 0, no abstraction is done. Finally, the rule selects the lowest term per branch that lies above a user-defined threshold.
When the EC weight is 1 for all evidence codes (no EC influence) and the GO weight is 0 (no abstraction), the annotation score equals the maximum similarity value of the hits that have the GO term, and the sequence is annotated with that GO term if the score is above the threshold. EC weights lower than 1 require higher similarities to reach the threshold. A GO weight different from 0 enables a parent node to reach the threshold even when its individual children do not.
Please cite: Götz S., García-Gómez JM., Terol J., Williams TD., Nagaraj SH., Nueda MJ., Robles M., Talón M., Dopazo J. and Conesa A. (2008). High-throughput functional annotation and data mining with the Blast2GO suite. Nucleic Acids Research, 36(10), 3420-3435.
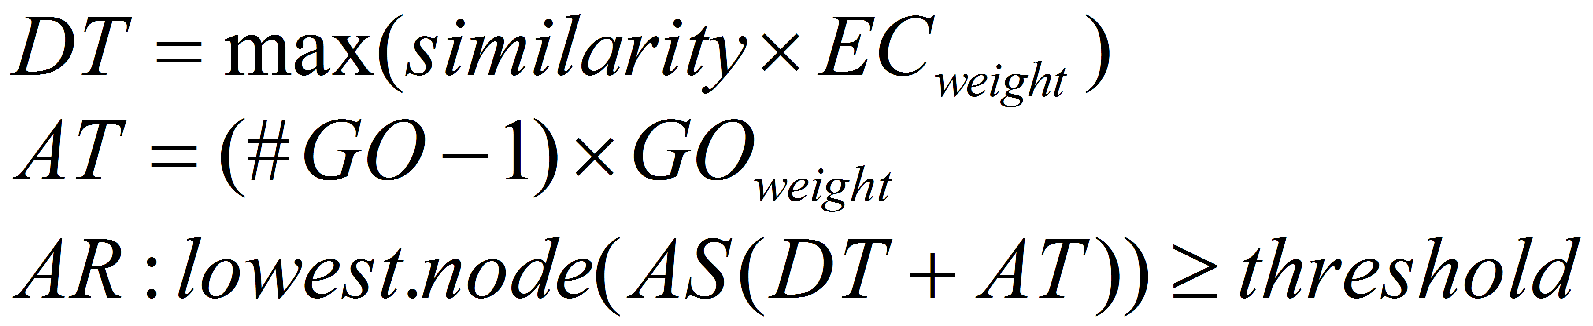
Figure 1. OmicsBox annotation rule.
Run
GO Annotation is available from the Side Panel of a Functional Annotation Project. It is mandatory that the project contains GO Mapping results.
Annotation Configuration
- Annotation Cut-Off. The annotation rule selects the lowest term per branch that lies above this threshold (default 55).
- GO-Weight. The weight given to the contribution of mapped children terms to the annotation of a parent term (default 5).
- Taxon. Removes the GO terms known not to be in the given taxonomy, using the restrictions defined by Gene Ontology. Write a taxonomy id.
- E-Value-Hit-Filter. A pre-filter: only GO terms obtained from hits with an e-value lower than this value are used for annotation or shown in a graph (default 1.0E-6).
- Hsp-Hit Coverage CutOff. The minimum coverage between a hit and its HSP. For example, 80 means the aligned HSP must cover at least 80% of the length of its hit. Only annotations from hits meeting this criterion are considered.
- Hit Filter. Consider only the first N hits during annotation. Correlative with the "Only hits with GOs" option.
- Only hits with GOs. Consider only hits that have a candidate GO term.
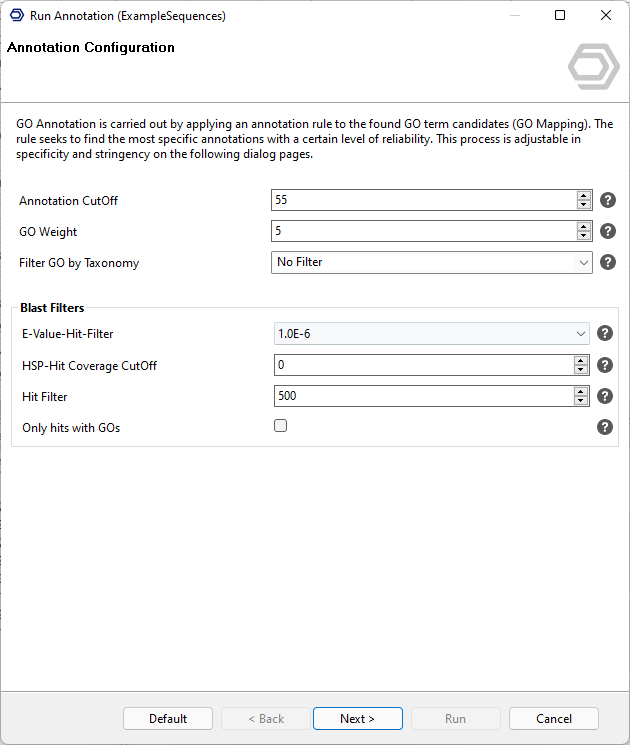
Figure 2. Annotation configuration.
Evidence Code Weights
Evidence Codes (ECs) promote the assignment of annotations with experimental evidence and penalize electronic annotations or those of low traceability. EC weights can be modified as needed: set them all to 1 to remove EC influence, or set an EC weight to 0 to exclude GO annotations of that code (for example IEA). A more detailed description of each EC can be found in the Gene Ontology website.
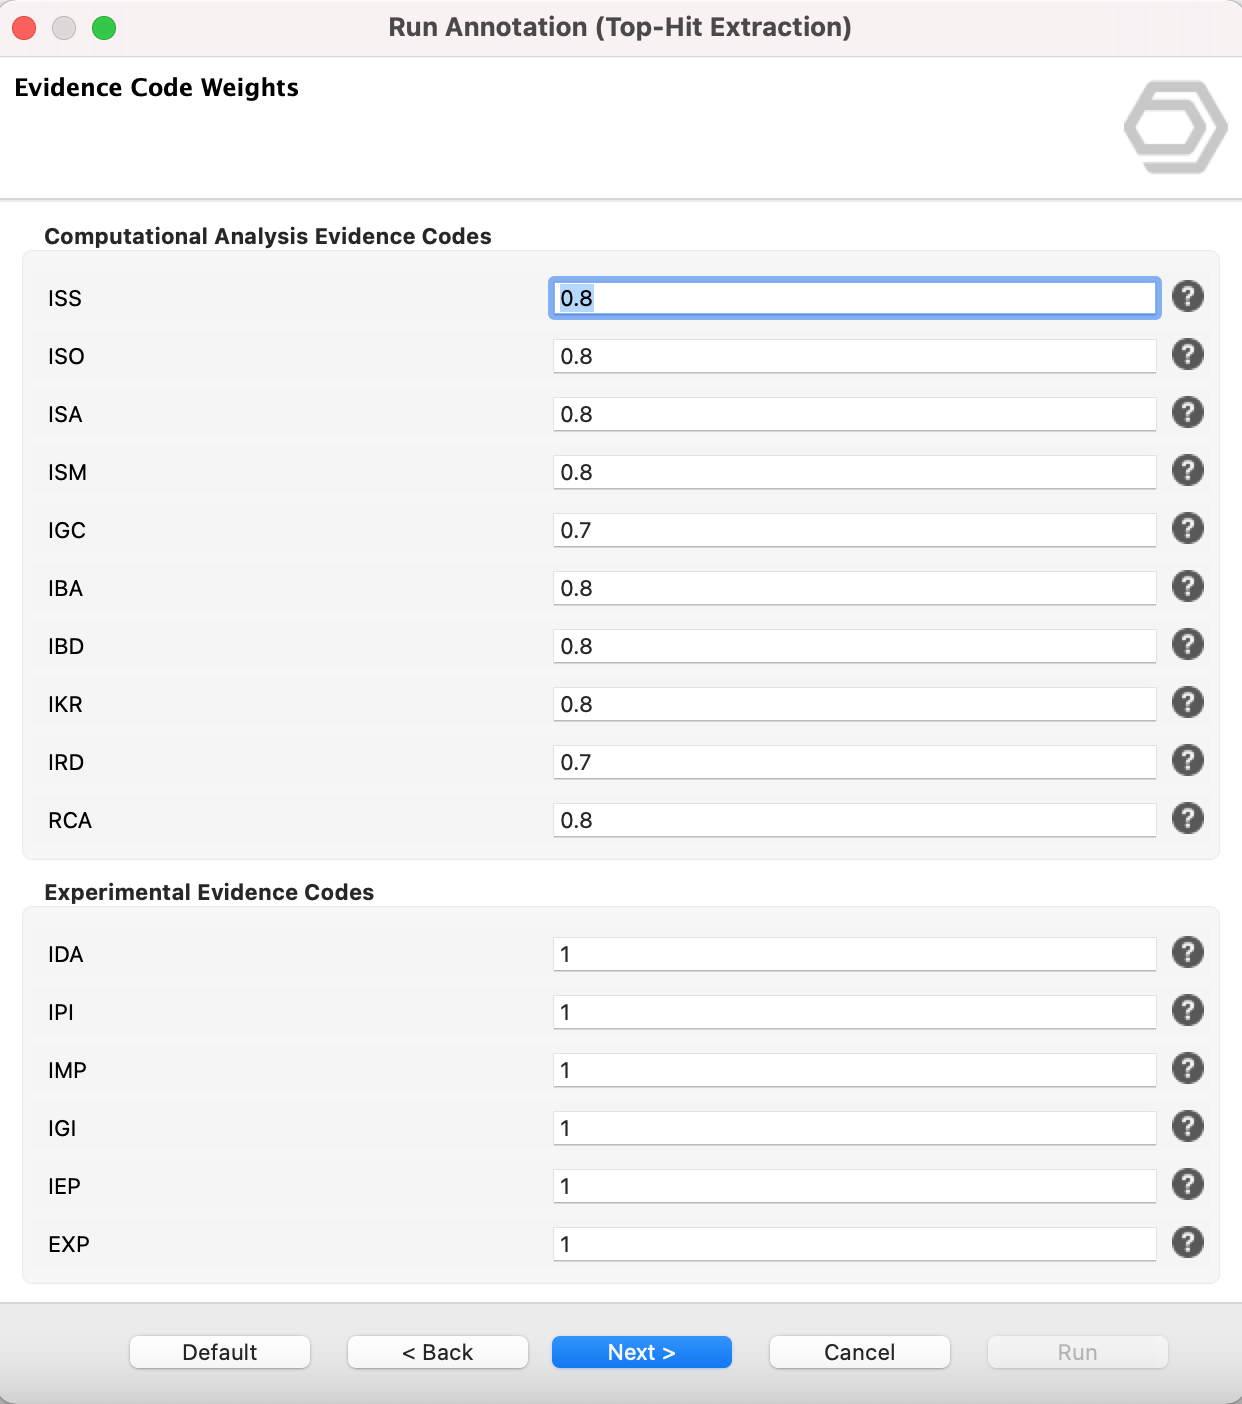
Figure 3. Evidence code weight configuration.
Results
Successful annotation changes the sequence colour to blue (ANNOTATED) in the functional annotation project, and only the annotated GO terms remain in the GO IDs column. The shared results table, its columns, and the common Side Panel and context menu options are described on the Functional Annotation Project page. This section covers only the annotation-specific results.
Charts
GO Annotation statistics
- Annotation Distribution. The number of GO terms assigned per sequence.
- GO Annot. Level Distribution. All GO terms for the three categories at a given GO level, taking the hierarchy into account.
- Annotation Score Distribution. The number of sequences per annotation score.
- Annotated Seqs/Seq-Length. The relation between the number of annotated sequences and sequence length.
- Number of GOs/Seq-Length. The relation between sequence length and the number of GO terms.
- GO Distribution by Level. All GO terms for the three categories at GO level 2, taking the hierarchy into account.
- Direct GO Count. The most frequent GO terms in the dataset for the Molecular Function, Biological Process, and Cellular Component categories, without considering the hierarchy.
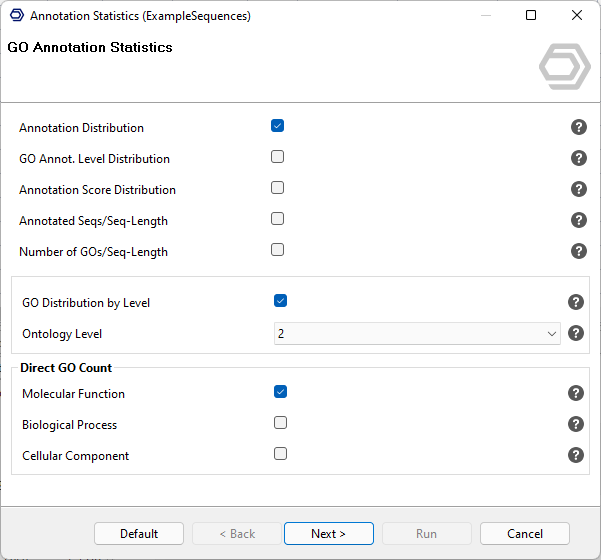
Figure 4. Annotation statistics.
EC-code statistics
- Main Enzyme Classes. The distribution of the 7 main enzyme classes across all sequences.
- Second Level Classes. The distribution of the enzyme subclasses.
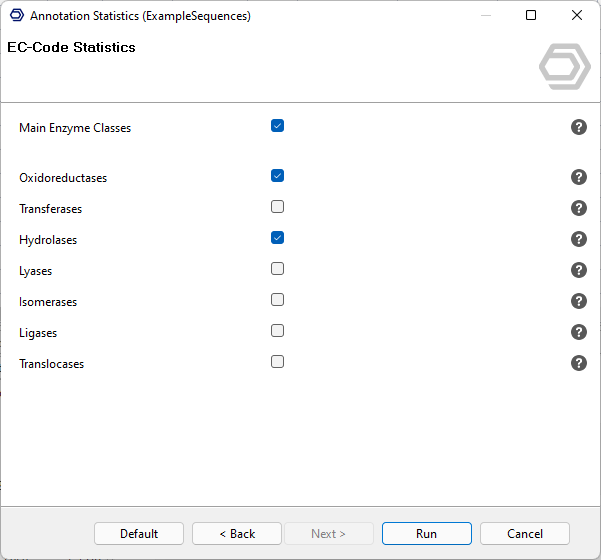
Figure 5. Enzyme code statistics.
Side Panel - GO Annotation
- Remove GO Annotation. Delete the annotation results for the selected sequences.
- Run EC-Code Mapping. Map GO annotations to enzyme codes for fully annotated sequences, using data from the Gene Ontology Consortium.
- Remove EC-Codes. Remove the enzyme codes from the project.
- Filter GO Annotations by Taxon. Filters out GO Annotations that are not valid for a certain NCBI taxon. E.g. The GO term "Lactation" is only valid for Mammalia and will be removed if any taxon outside the Mammalia class is selected.
- Validate GO Annotations. Ensure no parent-child redundancy is present in the annotated set (useful after annotations have been imported or changed manually).
- Remove 1st Level Annotations. Removes top-level annotations. In some cases the Gene Ontology top-levels (3 root terms: molecular function, biological process and cellular component) are assigned as annotations. These however are not considered valid since they do not provide relevant information. This cannot be undone.
- Annotate GOs from Descriptions. Look at every significant alignment for each sequence and search its description lines for GO ids, then annotate those GO terms if the alignment similarity passes the minimum. Validation can also be applied to remove intermediate GO terms.
- Compare GO Annotations. Compare a set of annotations for a group of sequences against the annotations already loaded in OmicsBox.
Context Menu
Right-click a sequence to open the Single Sequence Menu (see Functional Annotation Project for the shared options). The annotation-specific options are:
- Annotate Sequence. Run GO annotation on the single selected sequence, using the annotation configuration.
- GO-Mapping Graph with Annotation Scores. Visualize the sequence's mapping results and annotation on the GO directed acyclic graph.
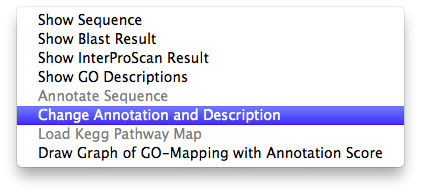
Figure 8. Manually change annotation and description.
Export Annotation Results
The annotation results can be exported in several formats from Side Panel → Export → Export GO Annotations:
- .annot. The default and exchange annotation format in OmicsBox. Three columns: sequence name, annotation code, and sequence description. Multiple annotations for a sequence come in subsequent rows. GO and EC annotations are exported jointly.
- Custom. Customize the exported information and the column separator.
- Genespring format. One row per sequence, with three columns for Molecular Function, Biological Process, and Cellular Component. GO terms are denoted by description.
- GoStats format. One row per sequence; GO terms are denoted by integers only.
- WEGO format (native). One row per sequence, including those without GO terms.
- GAF v.2. The GO Annotation File Format used by the GO Consortium.
- Export GO Propagation. Exports the GO parents up to the root for the annotated sequences.
- Export Sequences per GO (Gene Sets).
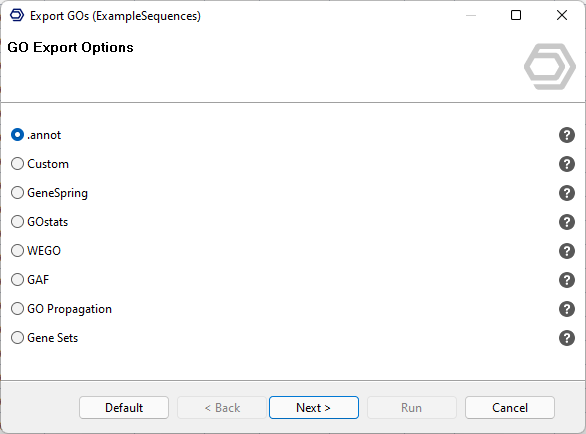
Figure 6. Export annotation configuration.
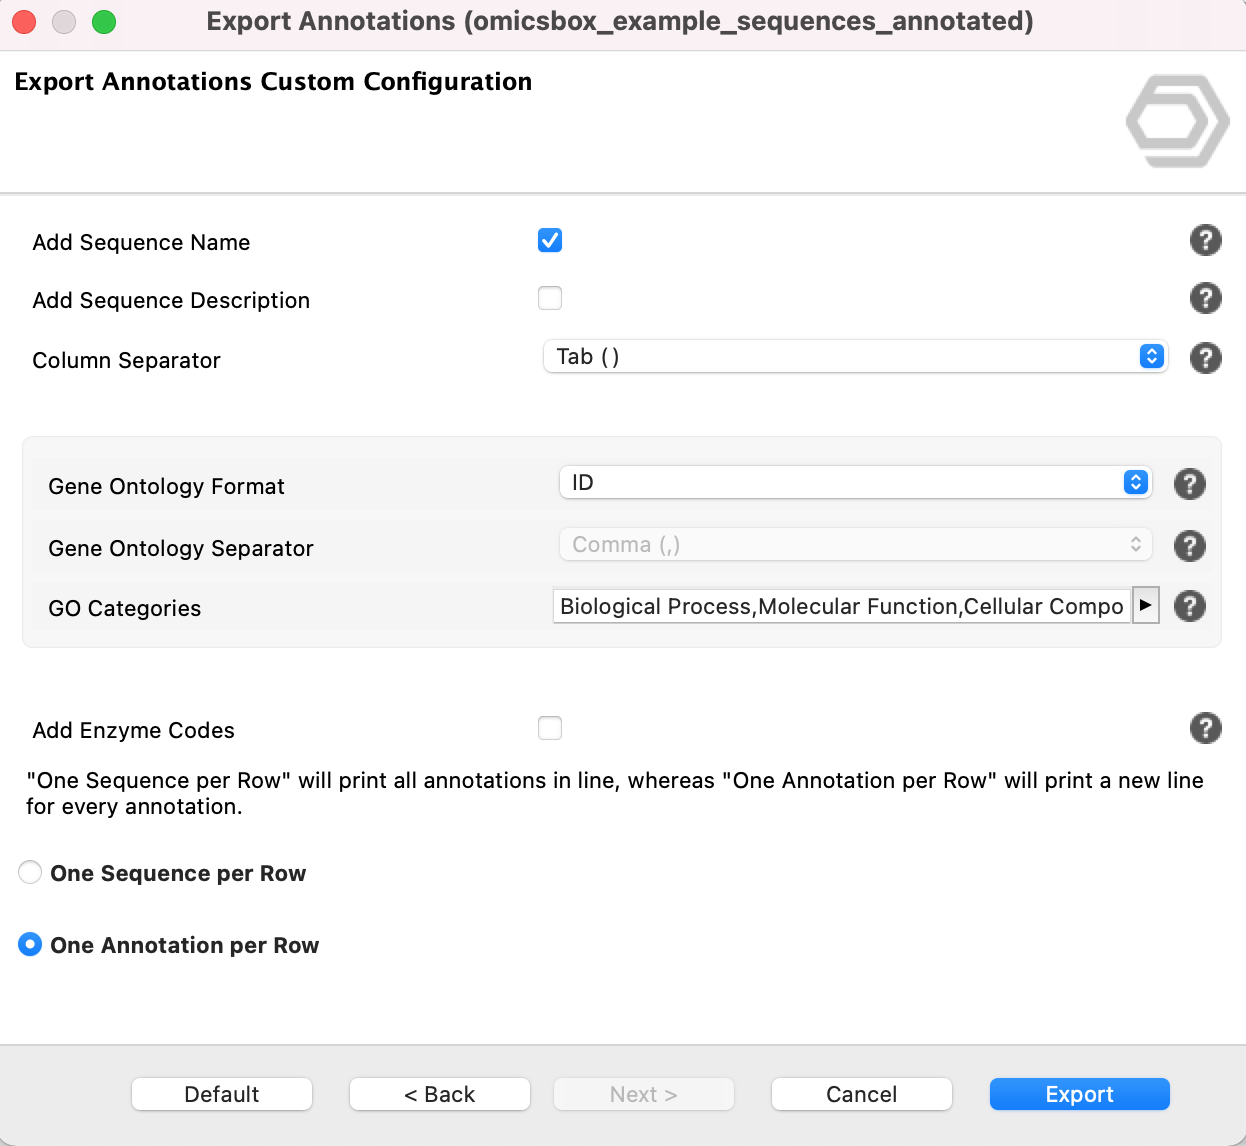
Figure 9. Export Annotations Custom Configuration.
Remove GO Annotation
Delete Annotation results for the selected sequences.
Merge EggNOG GOs
Once the sequences are annotated via EggNOG, it is possible to merge the GO terms and the EC codes (Enzyme Commission Codes) to a sequence project in order to add the new annotations. This can be done by clicking on project Side Panel → GO Annotation → Merge EggNOG GOs (figure 10).
In the wizard, you have to select the EggNOG project that has the GO annotations to merge with the current project. If the sequences already have annotated GO terms and/or ECs, the new information generated from EggNOG will be added to the annotations found in the project.
In addition, you can filter the annotations by E-value or Bit-Score.
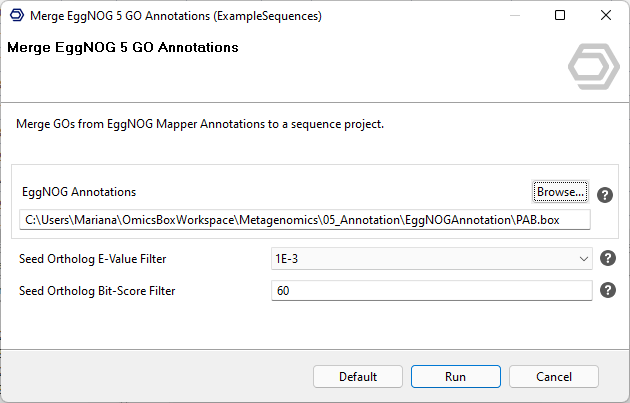
Figure 10. Merge EggNOG GO Annotations wizard.
Once finished, this step generates a bar chart showing the total number of GOs and ECs added to the original sequence project (figure 11).
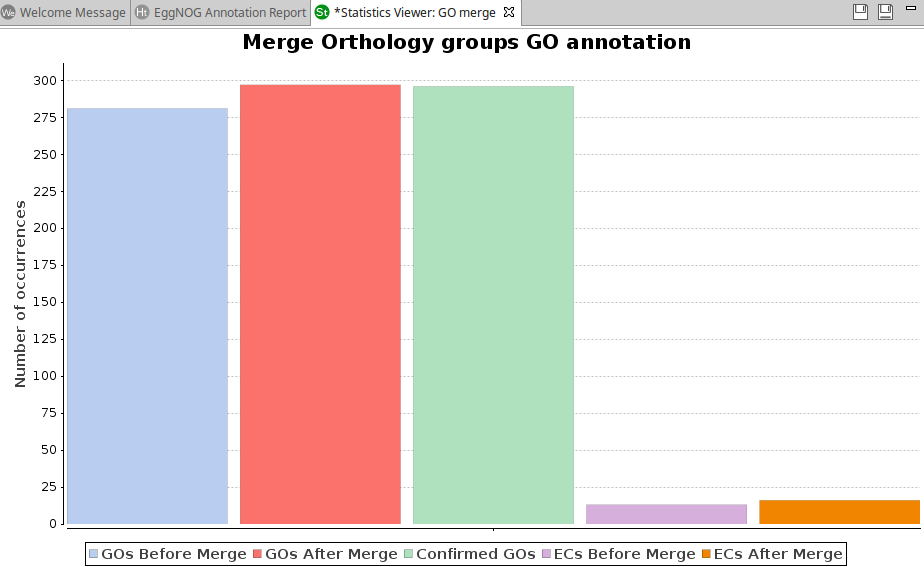
Figure 11. Merge EggNOG GO Annotations graph.
Annotate GOs from Descriptions
This tool looks at every significant alignment (Right-Click → Show Blast Result on a sequence) for each sequence and searches their description lines for GO ids. These GOs are now directly annotated to the sequence if the alignments similarity passes the desired minimum. Validation can also be applied and is recommended, it will remove intermediate GO terms.
There are still other annotation functions available in the submenu:
Other Annotation Functions in the Side Panel
- Run EC-Code Mapping: This will map GO annotations to EC-Codes for fully annotated sequences. The mapping data is provided by the Gene Ontology Consortium.
- Remove EC-Codes: This will remove the Enzyme Codes from the project.
- Filter Annotation by GO Taxa
- Validate Annotations. OmicsBox annotation generates the lowest node annotations. This is not always guaranteed when Annotations have been imported or changed manually. This function can be run to ensure that no parent-child redundancy is present in the annotated set.
- Remove 1. Level Annotations
- Annotate GOs from Blast Descriptions allows to transfer of GOs from the Blast hit descriptions to their sequences.
- Compare GO Annotations: Compare a set of annotations for a given group of sequences against the annotations already loaded in OmicsBox.
OmicsBox Engine
This tool can be run from the command line via the OmicsBox Engine.
Command: omicsbox annotation [options]
Inputs
| Flag | Type | Required | Description |
|---|---|---|---|
--i-project |
file | Yes | Sequence Project |
Parameters
| Flag | Type | Default | Range / Candidates | Required | Description |
|---|---|---|---|---|---|
--e-value-hit-filter |
enum | 1.0E-6 | 1063 |
No | E-Value-Hit-Filter |
--hit-filter |
integer | 500 | 1 – 500 | No | Hit Filter |
--only-hits-with-gos |
boolean | false | No | Only hits with GOs | |
--annot-cut-off |
integer | 55 | 0 – 1000 | No | Annotation CutOff |
--go-weight |
integer | 5 | 0 – 1000 | No | GO Weight |
--hsp-hit-coverage-cutoff |
integer | 0 | ≥ 0 | No | HSP-Hit Coverage CutOff |
--species |
string | No | Taxon | ||
--ec-ida |
double | 1.0 | 0.0 – 1.0 | No | IDA |
--ec-ipi |
double | 1.0 | 0.0 – 1.0 | No | IPI |
--ec-imp |
double | 1.0 | 0.0 – 1.0 | No | IMP |
--ec-igi |
double | 1.0 | 0.0 – 1.0 | No | IGI |
--ec-iep |
double | 1.0 | 0.0 – 1.0 | No | IEP |
--ec-exp |
double | 1.0 | 0.0 – 1.0 | No | EXP |
--ec-iss |
double | 0.8 | 0.0 – 1.0 | No | ISS |
--ec-iso |
double | 0.8 | 0.0 – 1.0 | No | ISO |
--ec-isa |
double | 0.8 | 0.0 – 1.0 | No | ISA |
--ec-ism |
double | 0.8 | 0.0 – 1.0 | No | ISM |
--ec-igc |
double | 0.7 | 0.0 – 1.0 | No | IGC |
--ec-iba |
double | 0.8 | 0.0 – 1.0 | No | IBA |
--ec-ibd |
double | 0.8 | 0.0 – 1.0 | No | IBD |
--ec-ikr |
double | 0.8 | 0.0 – 1.0 | No | IKR |
--ec-ird |
double | 0.7 | 0.0 – 1.0 | No | IRD |
--ec-rca |
double | 0.8 | 0.0 – 1.0 | No | RCA |
--ec-tas |
double | 0.9 | 0.0 – 1.0 | No | TAS |
--ec-nas |
double | 0.8 | 0.0 – 1.0 | No | NAS |
--ec-ic |
double | 0.9 | 0.0 – 1.0 | No | IC |
--ec-nd |
double | 0.5 | 0.0 – 1.0 | No | ND |
--ec-iea |
double | 0.7 | 0.0 – 1.0 | No | IEA |
--ec-nr |
double | 0.0 | 0.0 – 1.0 | No | NR |
Global options (
--local-folder,--cloud-folder,--output-format,--config,--detach,--verbose, …) are shared by every Engine tool and are not repeated here — see the OmicsBox Engine reference.