Gene Ontology Mapping
Introduction
GO Mapping is the process of retrieving the GO terms associated with the hits obtained by the Blast search. It is the second step of the Blast2GO methodology, between Blast Search and GO Annotation, and it builds a pool of candidate GO terms for each query sequence.
OmicsBox performs four mapping steps:
- Blast result accessions are used to retrieve gene names or symbols from two NCBI mapping files (
gene_info,gene2accession). Identified gene names are then searched in the species-specific entries of the gene-product table of the GO database. - GenBank identifiers (gi), the primary Blast hit ids, are used to retrieve UniProt IDs from a PIR mapping file (including PSD, UniProt, Swiss-Prot, TrEMBL, RefSeq, GenPept, and PDB).
- Accessions are searched directly in the dbxref table of the GO database.
- Blast result accessions are searched directly in the gene-product table of the GO database.
Please cite: Götz S., García-Gómez JM., Terol J., Williams TD., Nagaraj SH., Nueda MJ., Robles M., Talón M., Dopazo J. and Conesa A. (2008). High-throughput functional annotation and data mining with the Blast2GO suite. Nucleic Acids Research, 36(10), 3420-3435.
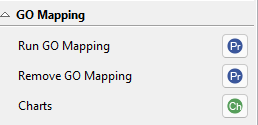
Figure 1. GO Mapping options.
Run
GO Mapping is available from the Side Panel of a Functional Annotation Project. It is mandatory that the project contains BLAST results.
The GO Mapping group of the Side Panel also provides Remove GO Mapping (delete mapping results for the selected sequences) and Charts (mapping statistics).
Results
Once mapping finishes, sequences turn green (MAPPED) in the functional annotation project and their candidate GO terms are shown in the GO columns. The shared results table and the common Side Panel and context menu options are described on the Functional Annotation Project page. This section covers only the mapping-specific results.
Charts
Three charts summarise the mapping step:
- GO Mapping Distribution. The distribution of the number of candidate GO terms assigned to each sequence during mapping.
- EC Distribution for Sequences. The distribution of GO Evidence Codes for the functional terms obtained during mapping, giving an idea of how many annotations derive from automatic or manually curated sources.
- EC Distribution for Blast Hits. The Evidence Codes associated with the obtained GO pool.
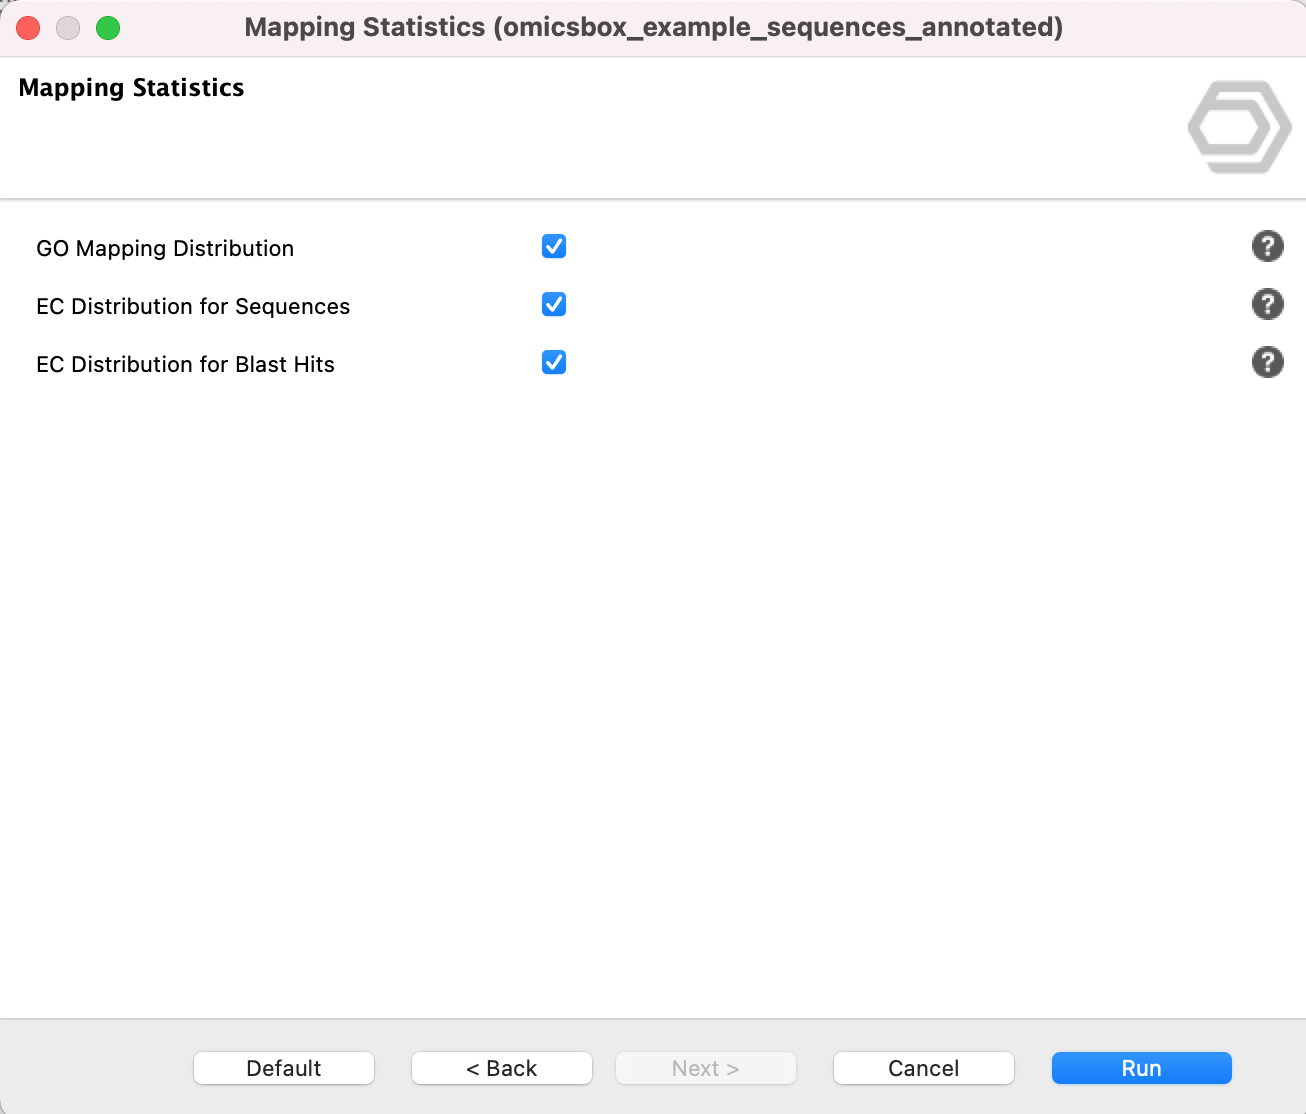
Figure 2. Mapping statistics.
Export
Export Mapping Results
A tab-separated text file with the mapping results.
Context Menu
Right-click a sequence to open the Single Sequence Menu (see Functional Annotation Project for the shared options). The mapping-specific options are:
- Show Mapping Results. Opens a table with the GO mapping results for the selected sequence.
- GO-Mapping Graph with Annotation Score. Displays a directed acyclic graph with all the GO terms related to the sequence, showing the terms from the mapping step. The wizard allows filtering the hits by e-Value and/or the HSP-hit coverage cutoff (see Gene Ontology Graphs for the graph visualization options).

Figure 3. Mapping results for a sequence.
OmicsBox Engine
This tool can be run from the command line via the OmicsBox Engine.
Command: omicsbox mapping-cloud [options]
Inputs
| Flag | Type | Required | Description |
|---|---|---|---|
--i-project |
file | Yes | Sequence Project |
Parameters
| Flag | Type | Default | Range / Candidates | Required | Description |
|---|---|---|---|---|---|
--latest-database-version |
boolean | true | No | Use latest database version | |
--goa-version |
enum | 2025_03 | 2025_032025_012024_052023_082021_112021_02 |
No | Goa Version |
Parameter relationships
| Flag | When | Effect | Affected flags |
|---|---|---|---|
--latest-database-version |
false |
enables | --goa-version |
Global options (
--local-folder,--cloud-folder,--output-format,--config,--detach,--verbose, …) are shared by every Engine tool and are not repeated here — see the OmicsBox Engine reference.