Gene Ontology Graphs
Introduction
The Gene Ontology structure can be described in terms of a graph, where each GO term is a node, and the relationships between the terms are edges between the nodes. GO is loosely hierarchical, with child terms being more specific than their parent terms. A child term may have more than one parent term. There exist different types of relationships between child and parent terms: is a (is a subtype of); part of; has part; regulates, negatively regulates, and positively regulates. Children that represent a more specific instance of a parent term have is a relationship with the parent. Children that are a constituent of the parent term have a part of a relationship.
The three GO categories (cellular component, biological process, and molecular function) are each represented by a separate root ontology term.
OmicsBox offers the possibility of visualizing the hierarchical structure of the gene ontology by directed acyclic graphs (DAG). OmicsBox integrates a viewer for graph visualization. It allows fast navigation and zooms on the GO DAG. OmicsBox provides various ways for the joint analysis of groups of annotated sequences.
It is possible to generate these graphs in OmicsBox:
- Simple GO Graph: Generates the GO graph of the provided GOs.
- Colored Graph: Generates the GO graph from a text file.
- Combined Graph: Generates the GO graph to visualize the annotation results.
Run
The Gene Ontology graphs are launched from Functional Analysis → Gene Ontology Graphs once a sequencing project has been loaded. Two sub-tools are available here: Simple GO Graph and Colored GO Graph, described below. The third graph type, the Combined GO Graph, is available from the project Side Panel and is documented separately in Combined Graph.
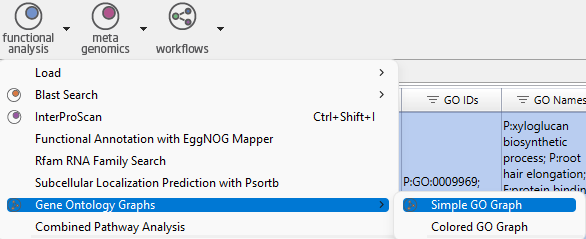
Figure 1: Simple GO Graph
Simple GO Graph
Provide a list of GO IDs or GO Names (figure 2) to represent on a graph.
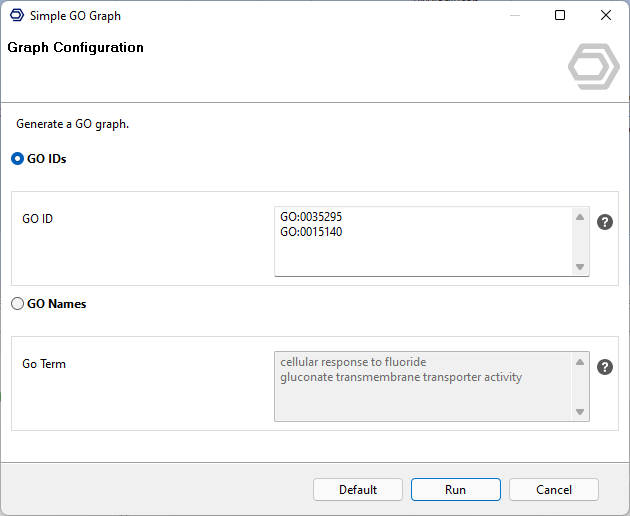
Figure 2: Simple GO ID Graph
Colored Graphs
A GO graph can be generated from a text (.txt) file which contains a list of GOs and the desired color for each of them. It is also possible to label groups of GOs with the same name. Figure 4 shows an example that was created introducing the following text file:
GO:0000003    6    Group A
GO:0040007    8    Group B
GO:0050896    1    Group B
The text file has to follow a simple structure, to be processed correctly. It may contain from 2 to 3 columns in each line. The first column has to contain a GO, the second a number (0.0 to  ) and the optional third column contains a text that will be written into the octagon of the corresponding GO. The columns must be separated with a tabulator character.
According to the example above Group B has two GO IDs that contain different values. It is also possible to differentiate these GO IDs by coloring according to their values. To color the octagon according to the value, select the gradient color on the color graph configuration window (see figure 6).
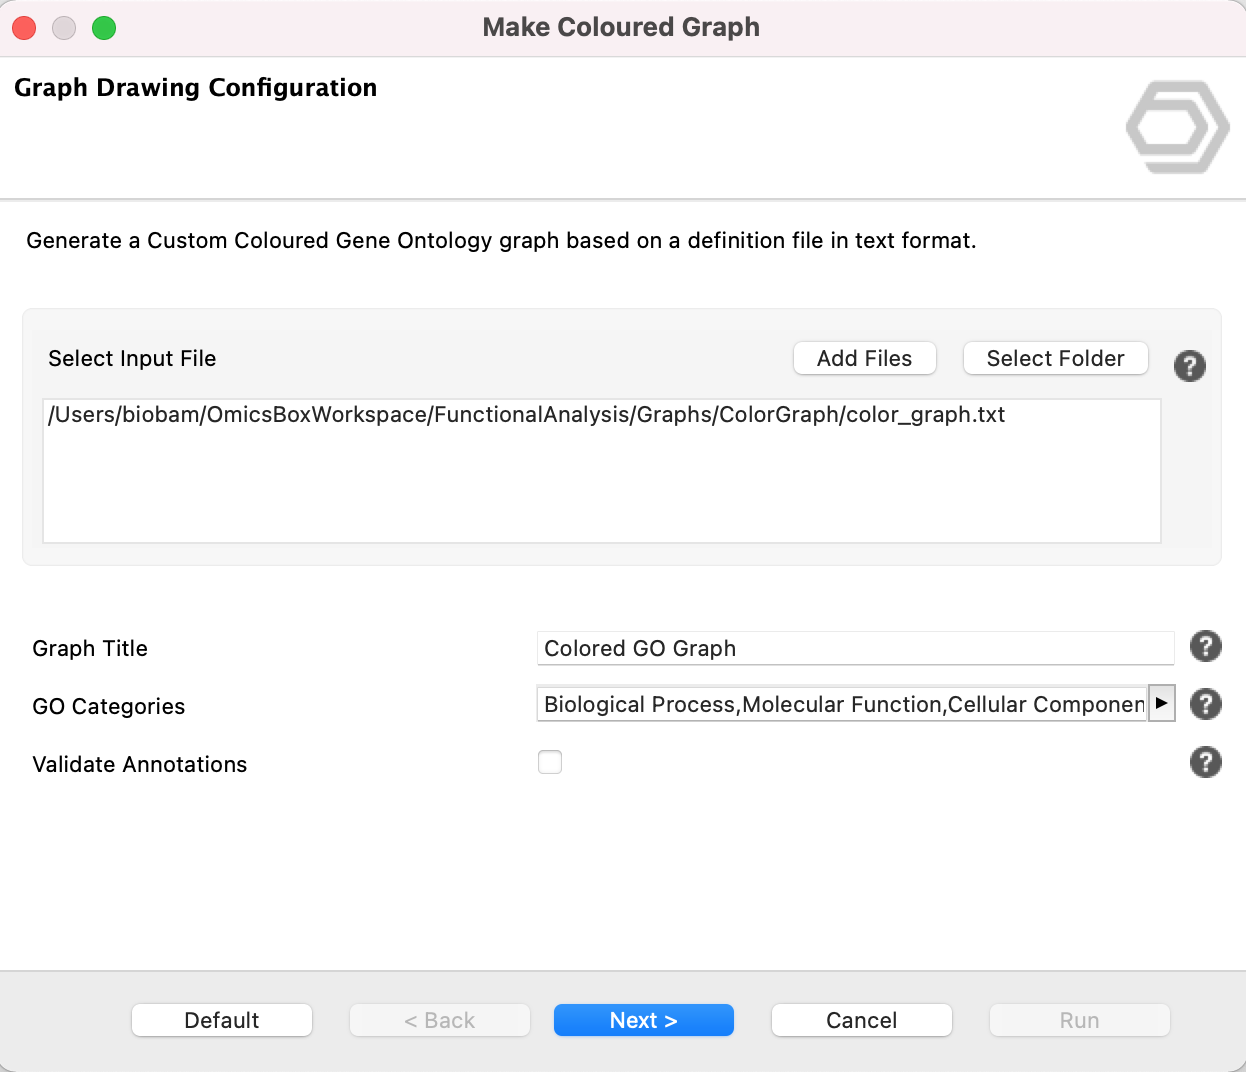
Figure 3: Colour Configuration Window
Reading a GO graph
A GO graph is a directed acyclic graph (DAG) that draws the selected GO terms together with all their ancestor terms up to the ontology root. It is laid out hierarchically: the most general terms (the category root) are at the top, and terms become more specific towards the bottom. Each node is a GO term and each edge is a relationship between a child and its parent (is a, part of, regulates, and so on), so following a node upwards to the root shows how a specific function is contained within broader ones.
Nodes are drawn with different shapes according to their role:
- Octagon: the GO terms of interest, that is, the terms provided or annotated.
- Box (square): intermediate ancestor terms added to connect the terms of interest up to the root.
- Ellipse: in the Combined Graph, a GO term directly linked to a Blast hit.
By default, nodes are coloured by GO category (Biological Process, Molecular Function, and Cellular Component). In a Colored Graph the colour instead encodes the group or value given in the input file, and in a Combined Graph it can encode a node score or the number of sequences. Each node label can show the GO ID, the GO name, and other details, and hovering over a node opens a tooltip with its full information.
The generated graph is interactive, and its content and appearance can be fine-tuned from the Side Panel: zoom, collapse or expand branches and re-layout the graph, search for a term, choose which information each node displays, filter nodes, and change the node colouring. These controls are shared with the Combined Graph viewer and are described in detail in Combined Graph.
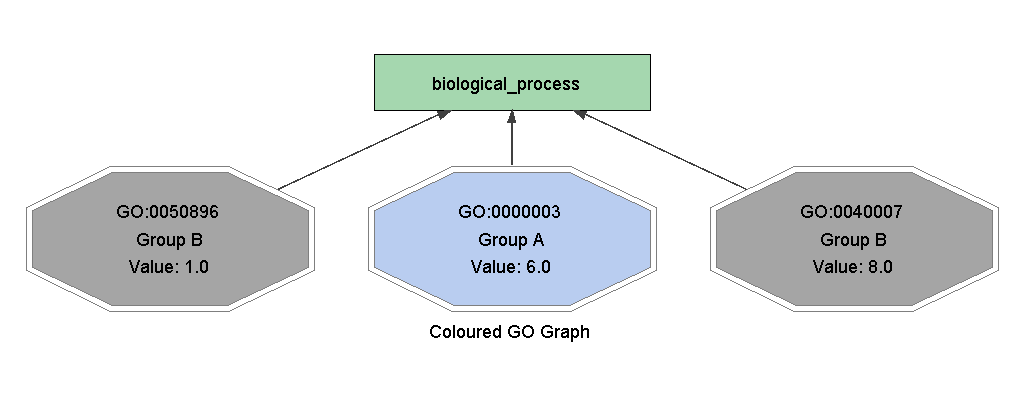
Figure 4: Coloured GO Graph by Group
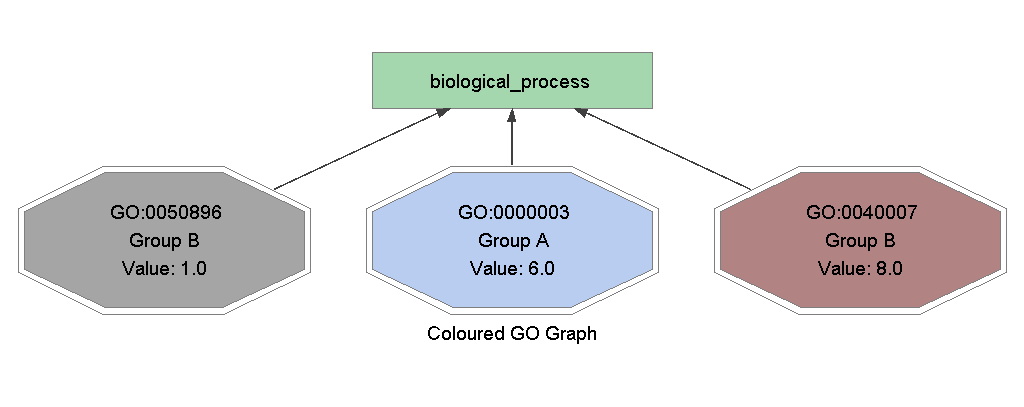
Figure 5: Coloured GO Graph by Group value
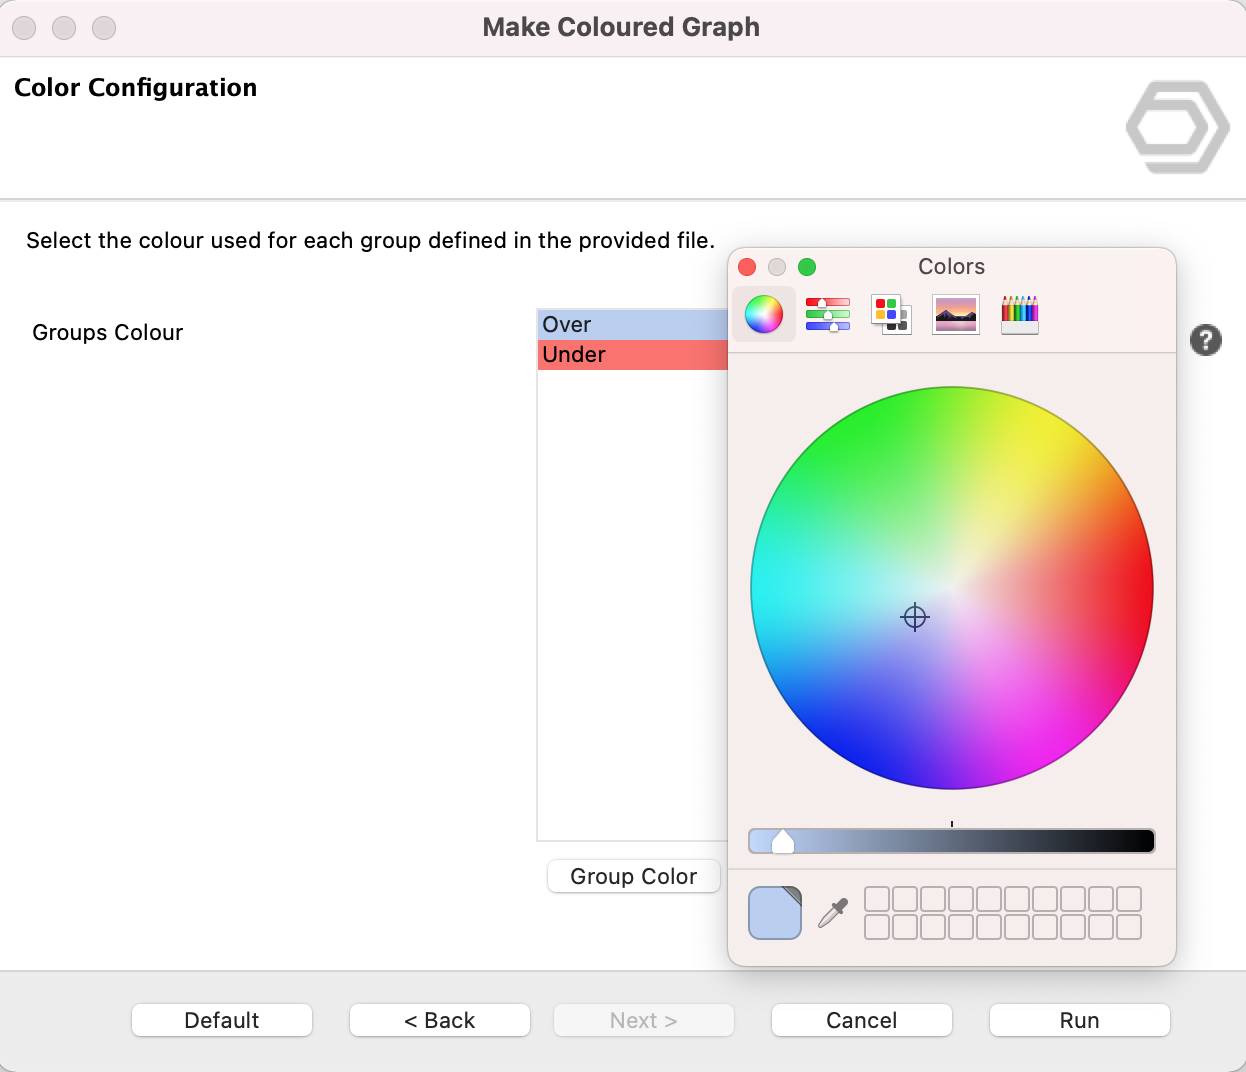
Figure 6: Select Colour to differentiate values within the same group.