Load
Load external files into OmicsBox objects (Figure 1).

Figure 1. Transcriptomics Load functions.
Load RNA-Seq / Protein Quantification Count Table
Load bulk RNA-Seq count tables or protein and peptide quantification tables from text files (Figure 2). Rows correspond to features (genes or proteins) and columns to samples. The first line must contain the column (sample) names and the first column must contain the feature names (Figure 3).
-
Data Type. The type of quantitative data in the file. It sets the default value of NA Values:
-
RNA-Seq: raw read counts. NA Values is set to Skip Line.
- Protein: protein or peptide quantification values, such as intensities or peptide and PSM counts. NA Values is set to Assume Zero Values, because missing values are common in these data and usually mean that the feature was not detected.
- Count Table File. Specify the count table file in .txt, .tsv, or .csv formats.
- Column Separator. The character that separates the columns: tab (" "), space (" "), comma (","), or semicolon (";")
-
NA Values. How to handle missing values (NA or empty cells). The default depends on the selected Data Type:
-
Skip Line: do not load the values for the entire row (feature).
- Assume Zero Values: replace the NA value with a 0.
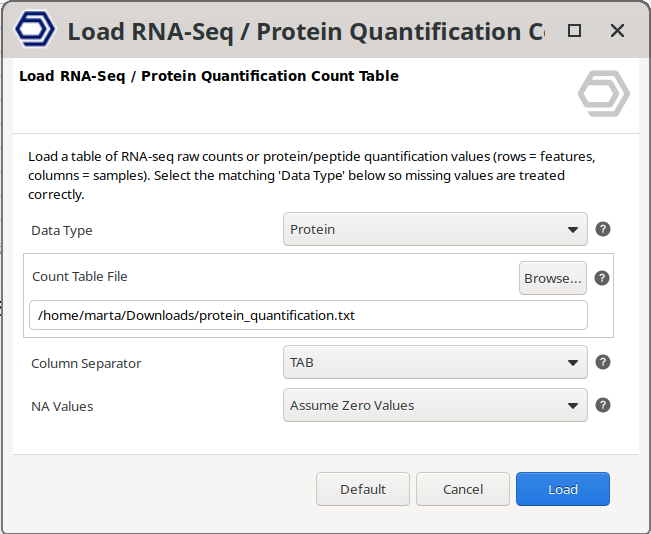
Figure 2. Load RNA-Seq / Protein Quantification Count Table wizard.

Figure 3. Example RNA-Seq Count Table txt file, separated by tabs.
Load RNA-Seq Pairwise Results
Load a tab-delimited file containing the results from a pairwise differential expression analysis (Figure 4). The table must meet the following conditions:
- It must contain the following mandatory fields: logFC, logCPM, PValue, and FDR.
- It must be tab-delimited.
- The type of information contained in each column must be indicated in its header (first line).
- The first column must contain the name of each sequence (gene or transcript). The column must be named Feature or Name.
- It may contain other column fields that are named according to their header.

Figure 4. Example Pairwise Results file.
Load Single-cell RNA-Seq Count Matrix
Load Single-cell RNA-Seq (scRNA-Seq) count matrices in different formats into OmicsBox (Figure 5). An scRNA-Seq Count Matrix object will be opened in a new tab.
-
Input Type. Select the format of the count table:
-
Matrix Market File. The output of bioinformatics tools like CellRanger or STARsolo. It consists of three parts: an MTX file (.mtx) with the locations of non-zero counts, a barcodes file with cell IDs (column names), and a features file with gene names (row names). The MTX file must meet the specifications explained here. Some important points to note:
- The barcodes and features files must not have a header.
- The number of lines in the barcodes and features files must match the size specified in the MTX file (Figure 6).
- The features file can have extra columns for feature metadata, separated by tabs. The first column should have Gene IDs, the second should have Gene Names, and any additional columns will be ignored.
-
Text File. Output of tools like RSEM, Drop-seq tools, etc. It is a text file similar to Figure 3, containing cells in columns and genes in rows.
-
Column Separator: Only enabled if Text File is selected. Specify the character that separates the columns: tab (" "), space (" "), comma (","), or semicolon (";")
- CellRanger H5. The output of CellRanger with .h5 extension. Other count matrices in H5 are not supported. The CellRanger’s format is explained in detail here.
- H5 Annotated Data. Another type of h5 files (with the extension .h5ad) that follow the AnnData format. This format stores the count matrix in a group named "/X", the cell metadata in a group named "/obs", and gene metadata in a group named "/var". Further specifications can be found here. It is the most commonly used format in databases containing annotated scRNA-Seq references.
- Loom Matrix File. It is the output of tools like Kallisto+BUStools, zUMIs, etc. It is another type of h5 file with a specific format, detailed here. The matrix has to be stored in a group named "/matrix", the cell names in a group named "/col_attrs/CellID", and the gene names in a group named "/row_attrs/Gene".
Additional options will be incorporated as new formats are developed to address user requirements.
When loading counts in MTX, Text, and H5 Annotated Data, fractional counts will be turned into integers. These fractional counts are generated by algorithms like Salmon, which distribute the counts of multi-mapping reads across the mapped genes, leading to decimal counts.
However, many scRNA-Seq analysis tools only accept integer counts. So, these fractional counts are converted to integers by removing the decimal part, not by rounding. This is done to avoid inflating the data size with many 0.5 counts being rounded up to 1, which wouldn’t be a meaningful count.

Figure 5. Load Single-cell RNA-Seq count matrix wizard.

Figure 6. Example of a scRNA-Seq count matrix in MTX format.