Functional Annotation Project
Introduction
The functional annotation project is the central results object of the Functional Analysis module. It is created when data is loaded (see Load Data) and is progressively enriched by the analysis steps of the module: Blast Search, InterProScan, GO Mapping, GO Annotation, Functional Annotation with EggNOG Mapper, and Subcellular Localization Prediction with PSORTb.
All of these tools read from and write to the same object: a table with one row per sequence, shown in the Main Viewer, plus a Side Panel and a context menu. Because the table, its status tags, the general Side Panel groups, and the common context menu options are shared by every step, they are described once on this page. Each tool page then documents only what is specific to that tool and links back here for the common parts.
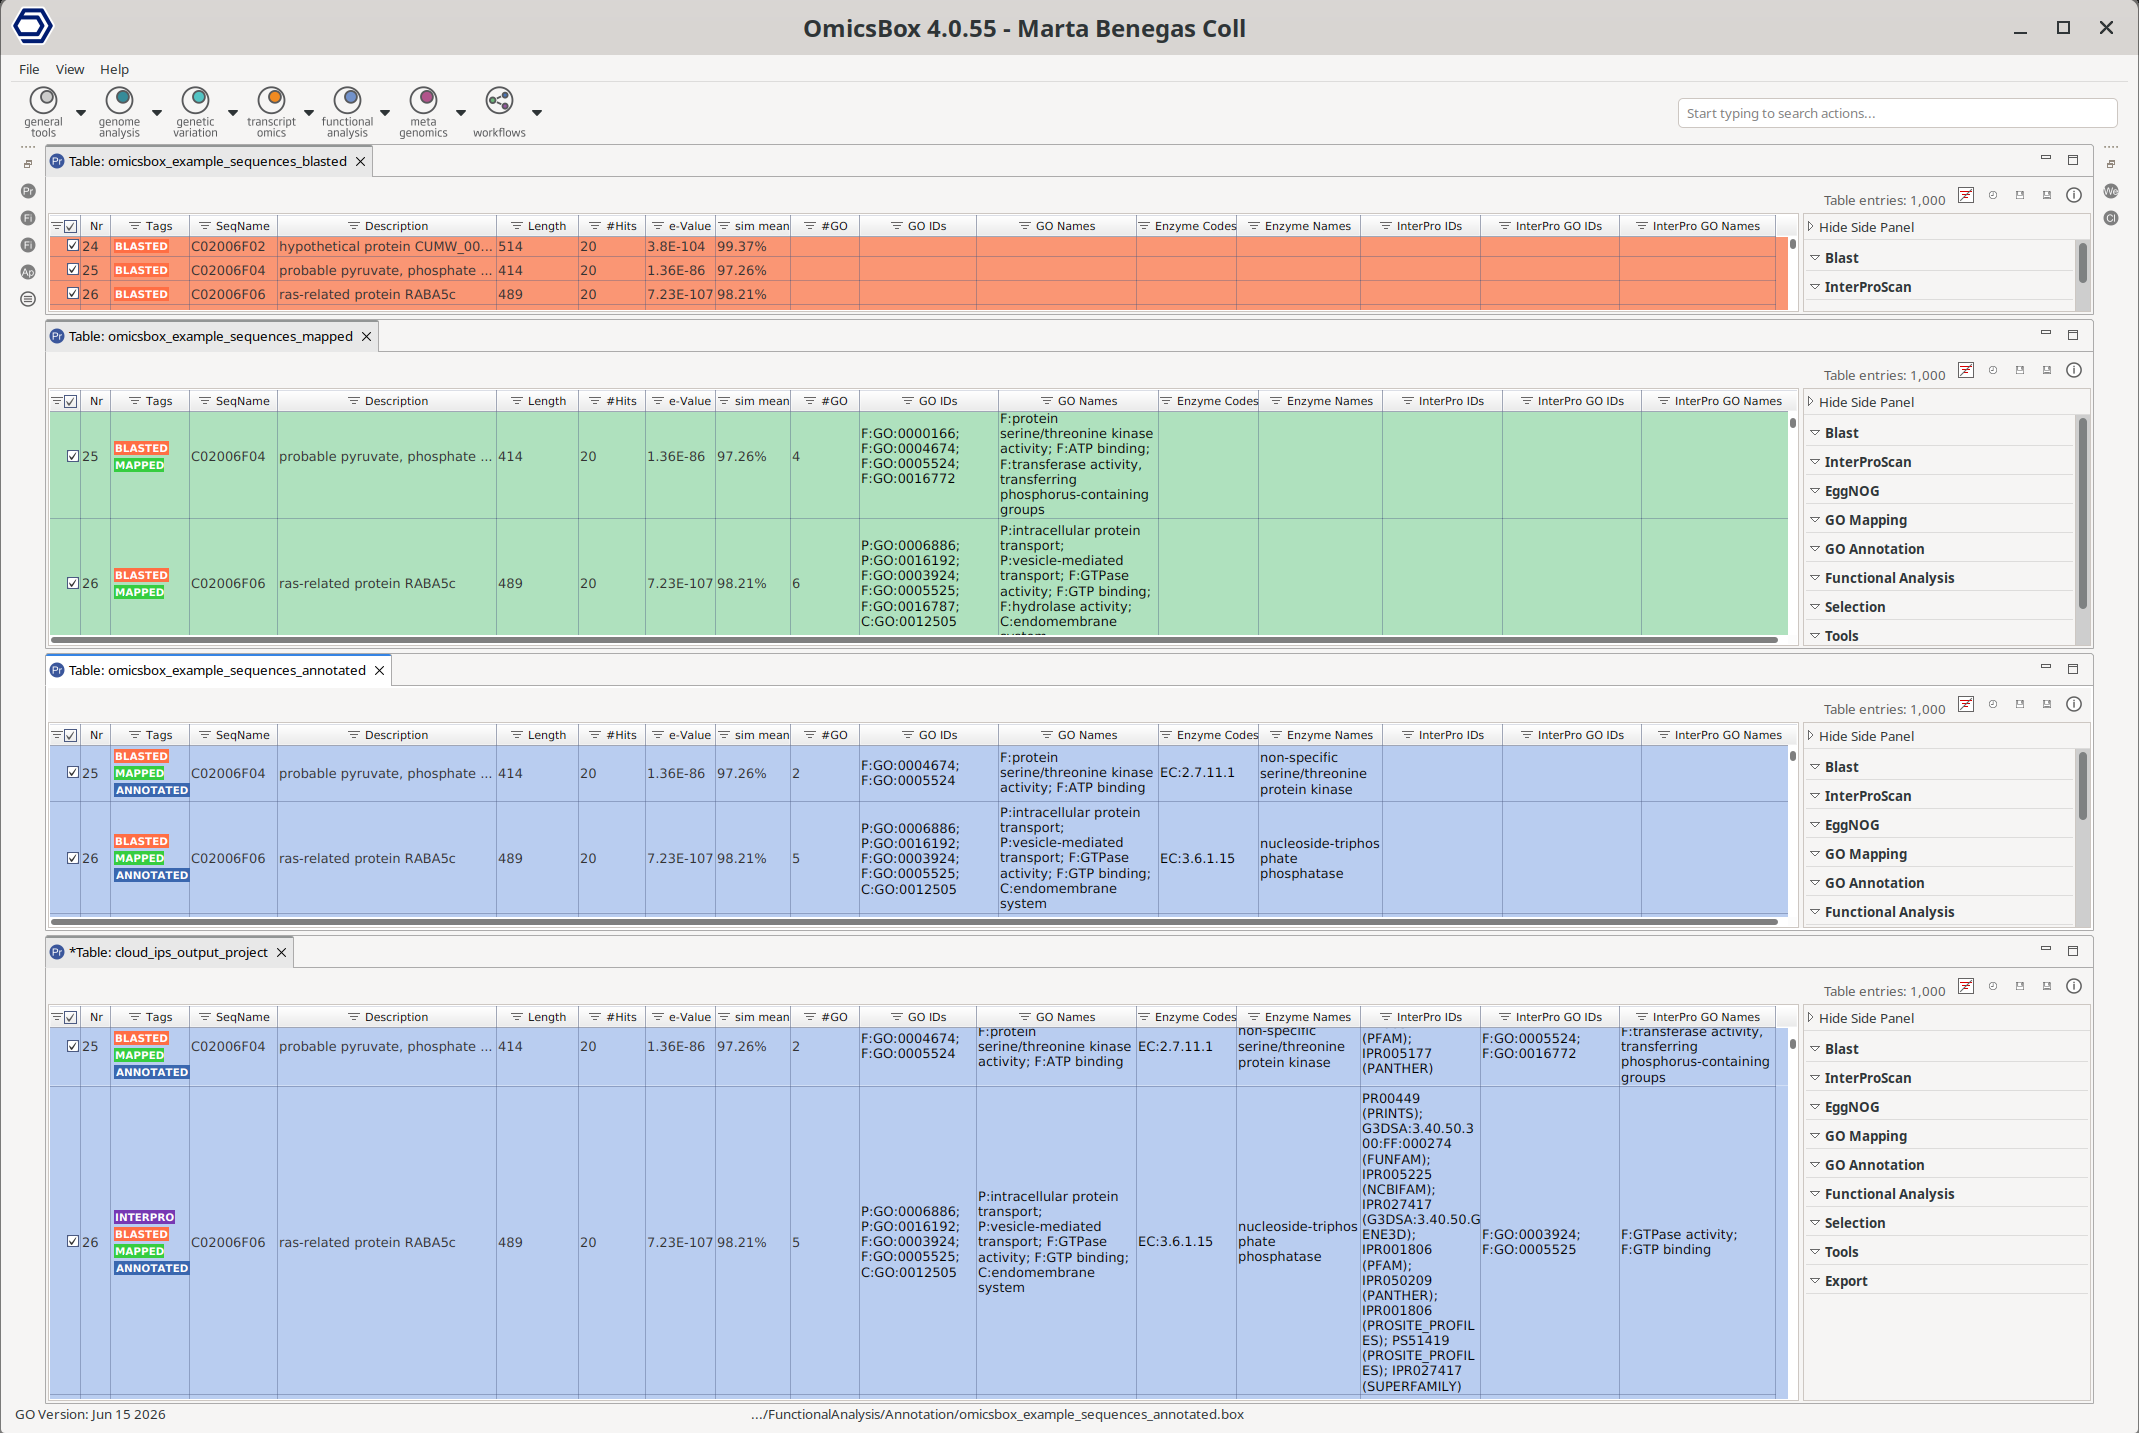
Figure 1. Main Sequence Table of a functional annotation project. From top to bottom: project with BLAST, GO Mapping, GO Annotation, and InterProScan results. The results of each step are added to the same project.
Main Sequence Table
The Main Viewer displays the project as a table with one row per sequence (Figure 1). Columns are filled as the analysis progresses. The most common columns are:
- Selection checkbox. Selects rows so that actions such as extract data or generate charts apply only to the selected part of the table.
- Nr. A consecutive number for each row.
- Tags. Status labels describing what has been computed for the sequence (see Tags and row colours).
- SeqName. The unique name of the sequence. Duplicates are not allowed.
- Description. The description line of the sequence. It is imported from the FASTA file and can be overwritten during annotation or manually.
- Length. The length of the sequence in amino acids or nucleotides, depending on the sequence type.
- #Hits. The number of hits obtained by Blast.
- e-Value. The lowest e-value obtained by Blast.
- sim-mean. The mean similarity obtained by Blast.
- #GO. The number of Gene Ontology (GO) terms obtained during mapping or annotation.
- GO IDs and GO Names. The Gene Ontology identifiers and names obtained during mapping or annotation.
- Enzyme Codes and Enzyme Names. The enzyme codes and their names linked to the GO terms of a sequence. Retrieved during annotation.
- InterPro GO IDs and InterPro GO Names. The GO identifiers and names obtained during the InterProScan step.
Tags and row colours
Each row is coloured and tagged according to the analyses that have been run on it. A sequence can carry several tags at once (for example BLASTED and MAPPED). The row colour always follows the most advanced tag, so an annotated sequence appears blue even though it has also been blasted and mapped. This state is shared across the whole module and is summarised in Table 1.
| State | Row colour | Tag |
|---|---|---|
| Loaded, without analysis | White | — |
| Blast hits found | Orange | BLASTED |
| Sent to Blast but no hits found | Red | NO-BLAST |
| Only InterProScan results | Purple | INTERPRO |
| GO Mapping done | Green | MAPPED |
| GO Annotation done | Blue | ANNOTATED |
| Reduced to GO-Slim | Yellow | GO-SLIM |
| Manually curated annotation | Pink | MANUAL |
Table 1. Row colours and status tags of the functional annotation project. The row colour matches the sequence's most advanced analysis state. Tag colours and labels are taken from the software.
The total number of sequences in each state can be reviewed with the data distribution and analysis progress charts (see General Charts).
Side Panel
The Side Panel groups the actions available for the project. Groups tied to a single step, Blast, InterProScan, GO Mapping, GO Annotation, and EggNOG, are described on their respective tool pages. The groups below are common to the project regardless of the current step.
Functional Analysis
This group gathers analyses that operate on the whole annotated project. Each has its own page:
- GO-Slim and Remove GO-Slim. Reduce the annotation to a GO-Slim subset, or restore the original annotations. See GO-Slim & Remove GO-Slim.
- Enrichment Analysis. Identify functions that are over- or under-represented in a set of genes, with Fisher's Exact Test (over-representation) or GSEA (ranked list). See Enrichment Analysis.
- Combined Graph. Visualize the joint annotation of a group of sequences on the GO directed acyclic graph. See Combined Graph for further details.
- Pathway Analysis. Identify biological pathways linked to the dataset sequences. See Pathway Analysis for further details.
Selection
Select a subset of sequences so that other actions (charts, exports, enrichment, deletion) apply only to them. A selected sequence is marked with its selection checkbox in the Main Sequence Table.
Select Sequences by Color
Select or deselect sequences by their row colour, that is, by their analysis status (see Table 1). Because the row colour follows the sequence's most advanced state, each colour selects a specific stage of the analysis (Figure 2).
For example, selecting Orange selects the sequences whose most advanced result is a Blast hit, in other words sequences that have only Blast results. Sequences that have Blast and GO mapping or annotation are green or blue, not orange, so they are not selected even if they also have the BLAST tag.
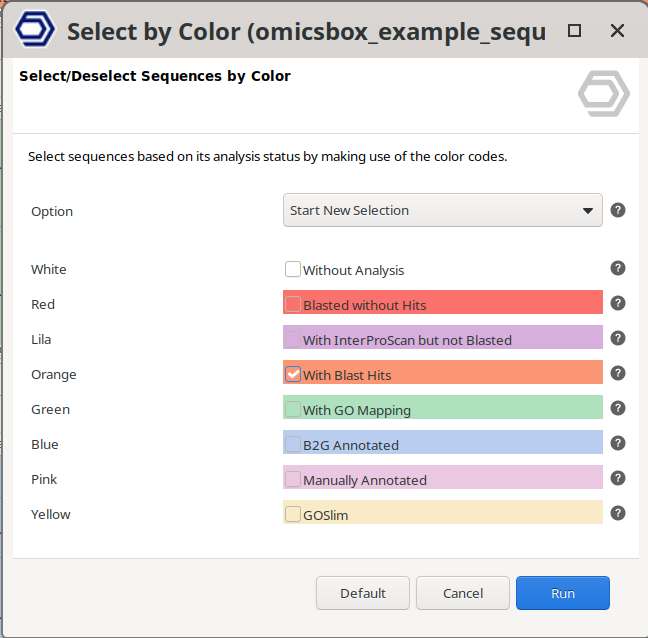
Figure 2. Select Sequences by Color dialog.
Select Sequences
Build a selection from a search. Sequences matching the provided pattern(s) will be selected using the "Selection Checkbox" column. The configuration parameters are:
- Option. How the matches combine with the current selection: Add to Existing Selection, Start New Selection (overrides current selection), Select from Existing Selection (only select from sequences already selected), or Remove from Existing Selection.
- Select by. The field the query is matched against: Sequence Name, Sequence Description, Species, Hit Description, Gene Name, Function (GO-Terms), Function (GO-IDs), InterProScan IDs, or Enzyme IDs.
- Match Type. For text fields, "Exact Match" looks for the exact provided string (can be many words), "Whole Word" looks for a single word in a string, or "Contains" looks for a small text within any word or string.
- Case Sensitive. If selected, the search will be case sensitive.
- Include more specific GO terms. Available for Function (GO-IDs). If selected, will also take into account sequences that are annotated with a more specific GO terms and therefore include this GO term as well (true path rule).
- Search Only Top Hit. Available for Species, Hit Description, and Gene Name, restricts the search to the top Blast hit.
- Text. Type the search patterns directly on the "Search" box.
- File. Provide the search patterns on a text file or an ID list, which has to be provided in the "Select File" box.
Invert Selection
Invert the current selection: selected sequences become deselected and vice versa.
Delete Selection
Permanently remove the selected sequences from the project. This ignores any column filters.
Warning
This action cannot be undone.
Tools
General utilities for the project.
General Charts
Generate the project statistics charts, which summarise how many sequences are in each analysis state as a data distribution chart and an analysis progress chart.
Find Duplicates
Find sequences that are exact duplicates of one another within the project, so they can be reviewed or removed.
Find Similar Sequences
Detect, select, and remove similar sequences within a project by defining a similarity threshold. To detect only identical sequences use "Find Duplicates" instead. This function makes use of BLAT by Jim Kent. Commercial users require a license from Kent Informatics.
Set to Sense
Reverse-complement sequences to their sense orientation based on their best Blast hit. It therefore requires Blast results.
Batch Rename
Perform a batch rename of all selected sequences by converting, replacing or adding text to the actual sequence name.
- Add. Add a text to a fixed position of the sequence names.
- Position. Where to add the text: Beginning or End of the name.
- Text. Write the text to add.
- Replace. Replace the sequence names or a matched text with another string.
- Use Mapping File. If checked, specify a file that contains the original sequence names on one column, and the new names on a second column separated by a tab. Sequence names in the project not present in the file won't be changed.
- Find. Write a specific text or regex to find in the sequence name. Only available if the "Use Mapping File" is unchecked.
- Replace with. Write the text to replace the matching string in "Find". Leave it empty to delete the text specified in "Find".
- In case of non-unique IDs add counter: Start with. Define the starting number of the counter for non-unique sequence names.
- Convert to. Convert the whole sequence name to upper or lower case.
Translate Longest ORF
Find the longest open reading frame (ORF) of each nucleotide sequence and translate it to protein, for example before a protein-based analysis such as InterProScan or PSORTb. Configuration parameters:
- Frames. The reading frame(s) to consider. With the default "Top-Blast-Hit", the frame of the best BLASTX hit is used to identify the longest ORF; alternatively, one or more of the six reading frames can be selected.
- Fallback to any Frame. If the chosen frame(s) cannot be translated, search the remaining frames. Enabled by default.
- Genetic Code. The genetic code used for translation, from the NCBI list. Default: Standard.
- Start Codons. The start codons of the selected genetic code, separated by commas. Default: AUG, CUG, UUG.
- Allow Open End. When no stop codon is found, translate the longest open-ended sequence. Disabled by default.
- Minimum Length (AA). Minimum length of the predicted ORF once translated to protein. Default: 100.
- Add _ORF to Sequence Names. Append
_ORFto the names of the translated sequences. Available when Keep Nucleotides is off. - Extract ORFs to New Project. Place the translated sequences in a new project (see output below).
- Keep Nucleotides. Instead of translating, reduce the original nucleotide sequence to the ORF that was found.
The output depends on Extract ORFs to New Project: when it is checked, the translated sequences open in a new tab as a separate project and the original project is left unchanged; when it is off, the sequences of the current project are replaced in place by their ORFs.
Combine Projects
Merge two functional annotation projects into a single project. Sequences are matched by their name, which is their unique identifier. Configuration parameters:
- Project to Combine With. The second project to merge with the current one.
For each type of information, Sequence Data, Sequence Description, Blast / GO Mapping, GO Annotation, and IPS Annotation, decide how it is merged into the main project:
- Add. Add the information from the other project only where it does not already exist in the main project.
- Skip. Ignore this information and keep the main project unchanged.
- Replace. Force a replace where the other project has information. Existing values are not overwritten with empty ones.
The combined project opens in a new tab; the two source projects are left unchanged.
Export
Export the project data in different formats.
- Export Table. Export the contents of the Main Viewer to a tab-separated text file.
- Generic Export. A configurable export in which the fields (columns) to include and the column and item separators can be chosen.
- Export as FASTA File. Export the sequences in FASTA format with their description and GO IDs or GO terms.
- Export GFF. Export the annotations as a GFF3 file. Specific to GO Annotation results.
- Export Blast Top-Hit. Export the top Blast hit of each sequence. Specific to Blast results.
- Export Mapping Results. Export the GO mapping results. Specific to GO Mapping results.
- Export GO Annotations. Export the annotation results in
.annotand other formats. Specific to GO Annotation results.
Context Menu
Right-clicking a row opens the Single Sequence Menu, which applies to the selected sequence (Figure 3). The options that apply to a single step open the detailed results of that step and are documented on the corresponding page; here they are only listed with a link.
- Show Sequence. Open the sequence viewer. It shows the sequences with different colors for each base, as well as other configurations. It also allows to copy the sequence to the clipboard.
- Show Blast Result. Open the Blast result of the sequence. See Blast.
- Show InterProScan Results. Open the InterProScan result of the sequence. See InterProScan.
- Show Mapping Results. Open the GO mapping result of the sequence. See GO Mapping.
- Show GO Descriptions. List GO ID, description, type, and definition for the GO terms of the sequence, with a link to the AmiGO browser.
- Copy Sequence Names to Clipboard. Copy the names of the selected sequences to the clipboard.
- Annotate Sequence. Run GO annotation on the single sequence. See GO Annotation.
- Change Annotation and Description. Edit the annotation and description of the sequence, and mark it as manually annotated (pink tag). See GO Annotation.
- GO-Mapping Graph with Annotation Scores. Draw the GO directed acyclic graph of the sequence, showing the mapping results with their annotation scores. See GO Mapping.
- Find Pathways via Annotations. Search for biological pathways linked to the sequence through its annotations. See Combined Pathway Analysis.
- AI Annotation Summary. Generate an AI-powered summary for the selected sequence, including its Blast hits, GO term annotations, enzyme codes, and InterPro domains. It requires an internet connection and uses complimentary cloud units.
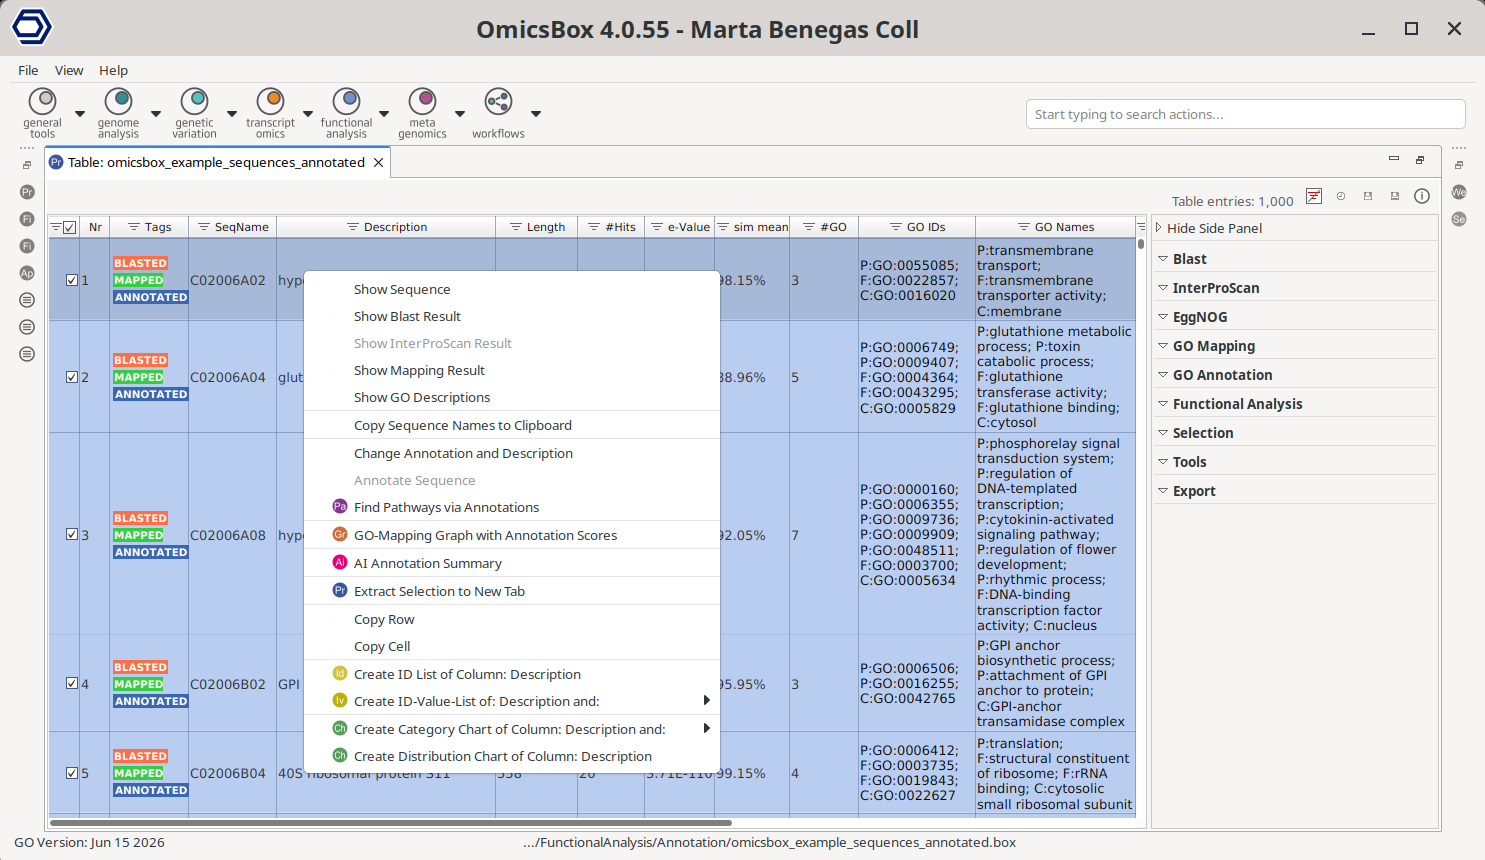
Figure 3. Context menu of the Main Functional Annotation Table.