Differential Abundance Analysis of Functions
Introduction
The Metagenomics Functional Differential Abundance Analysis tool is designed to detect which functional annotations are enriched between two different environmental conditions. The statistical test of this tool is based on an over-dispersed Poisson generalized linear model, specifically designed to detect the differentially abundant annotations between metagenomes.
The analysis needs one metagenomic annotation, Pfam or EggNOG, per sample, and the condition to which each sample belongs, as inputs. To generate the annotations, some previous steps have to be performed in OmicsBox. Starting from raw reads for each sample, a Quality Control, a metagenomic assembly, a gene-finding step, and finally an annotation step have to be run for each sample to obtain one annotation file per sample, as shown in Figure 1. The annotation files are used as input for the metagenomics functional differential abundance test.
This tool is based on the ShotgunFunctionalize library and on HirBin.
The Functional Differential Abundance Test only allows selecting one type of annotation, Pfam or EggNOG.
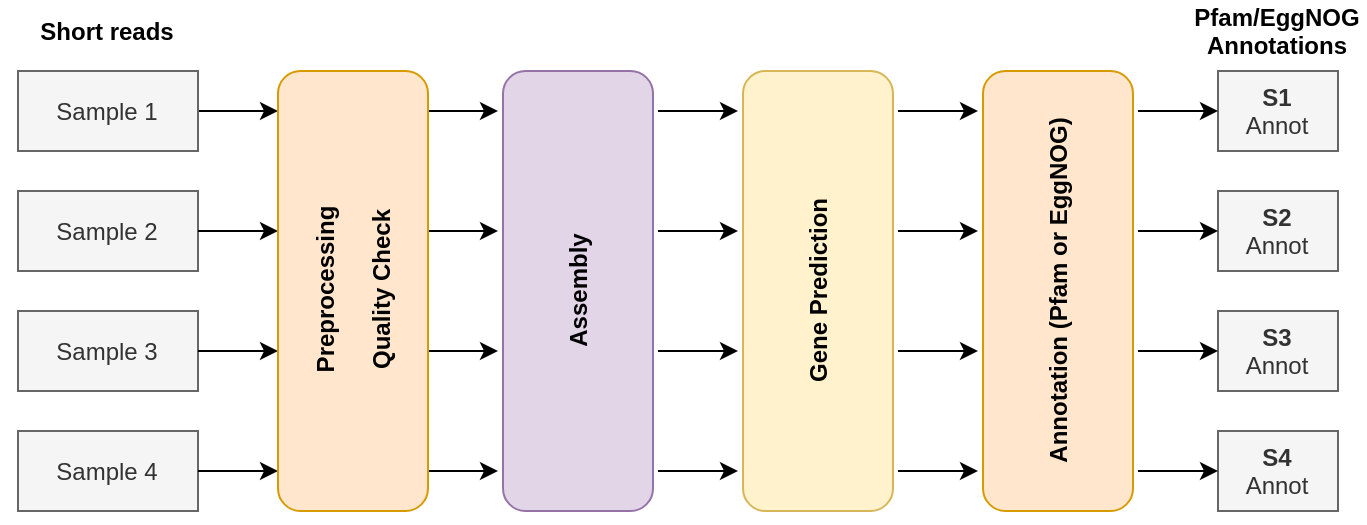
Figure 1. Steps previous to the Functional Differential Abundance Analysis.
Run Differential Abundance Analysis of Functions
The general workflow of this tool is shown below (Figure 2).
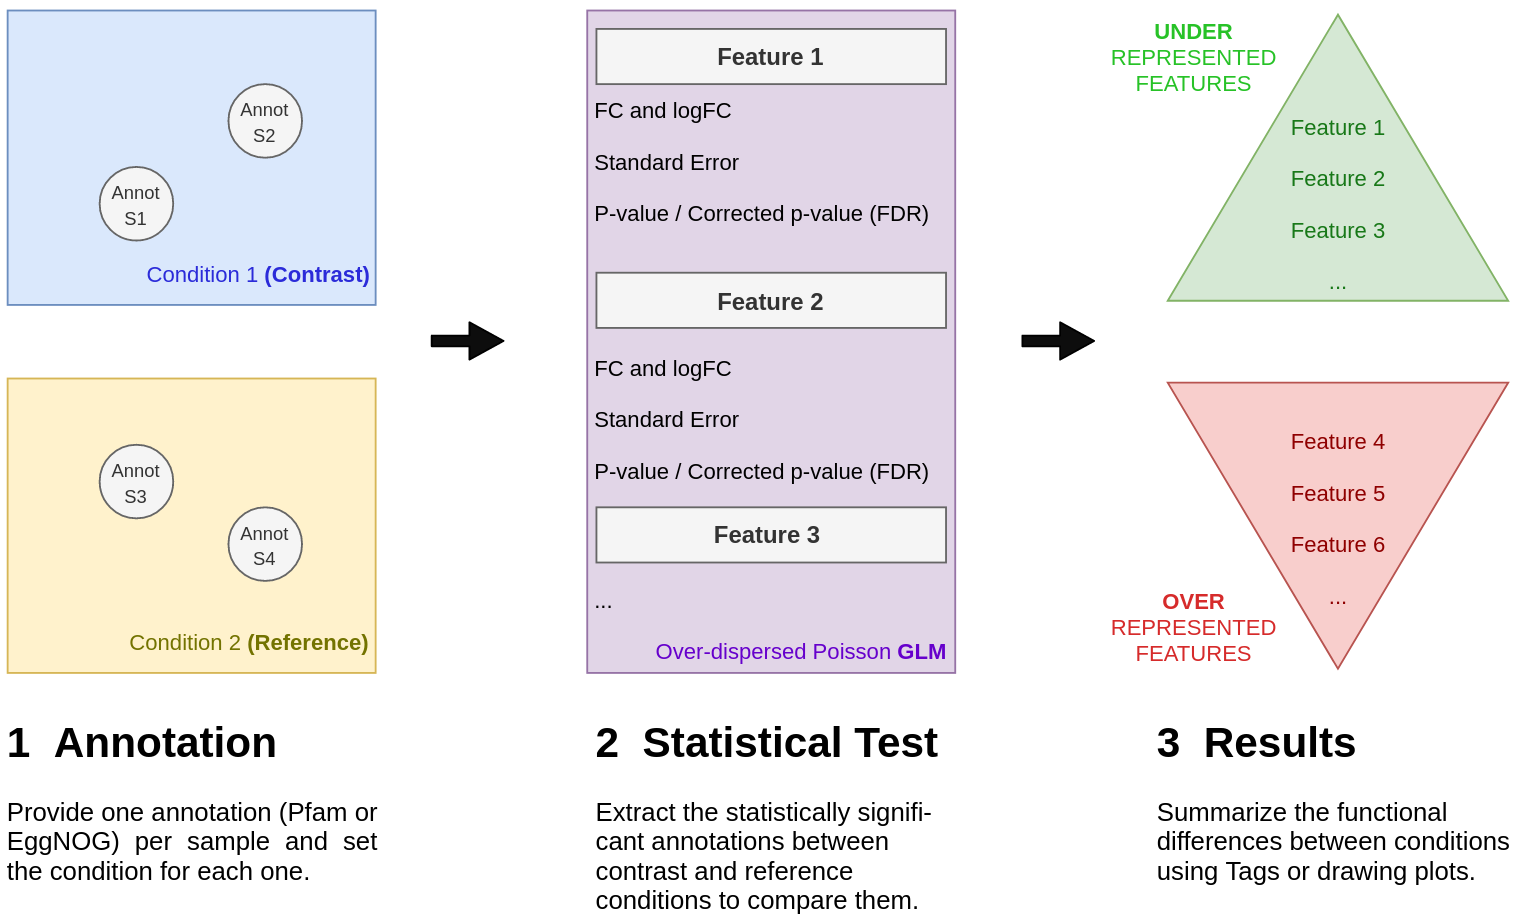
Figure 2. Functional Differential Abundance Analysis: general workflow.
To run the analysis, go to Metagenomics → Comparative Analysis → Differential Abundance Analysis of Pfam / EggNOG. The wizard allows the selection of the annotation files, the experimental conditions, and other parameters for the test (Figure 3 and Figure 4).
Input Page
On this page, the annotation files of the different samples have to be uploaded as input (Figure 3).
In this section, you can also select the items to compare. This depends on the type of annotations you provided:
- Pfam Annotations. You can compare at Pfam Domain level or at Pfam Family level.
- EggNOG Annotations. You can compare at Cluster of Orthologous Groups level, COGs, arCOGs, and KOGs, or at KEGG Pathways level.
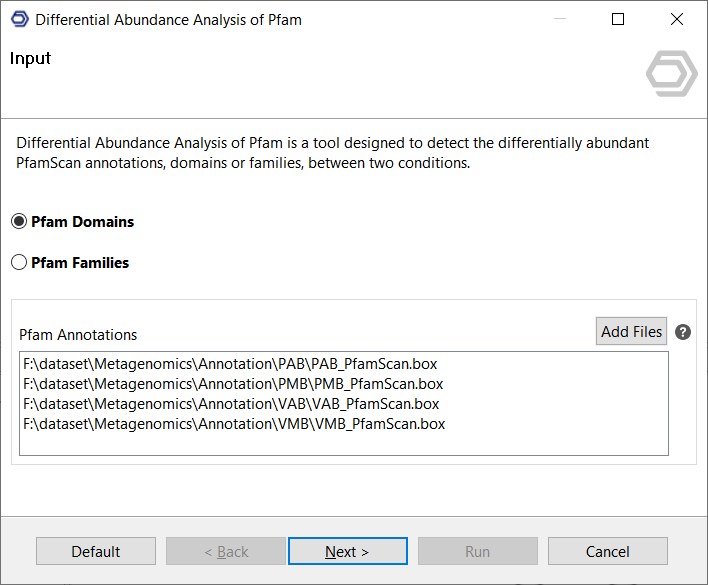
Figure 3. Functional Differential Abundance Analysis wizard: input page.
Configuration Page
Here, the two groups for the test, reference and contrast, have to be specified (Figure 4). You can select the groups by choosing which samples from the annotation files previously loaded you want to include in each condition.
Filtering
Some annotations are poorly present in the dataset and can cause false positives or alter the statistical test by including non-testable features. In Counts Filter, you can set the minimum number of times a feature has to be annotated to be included in the statistical test. We highly recommend setting this filter to a number at least equal to the number of samples in the dataset (default = 1).
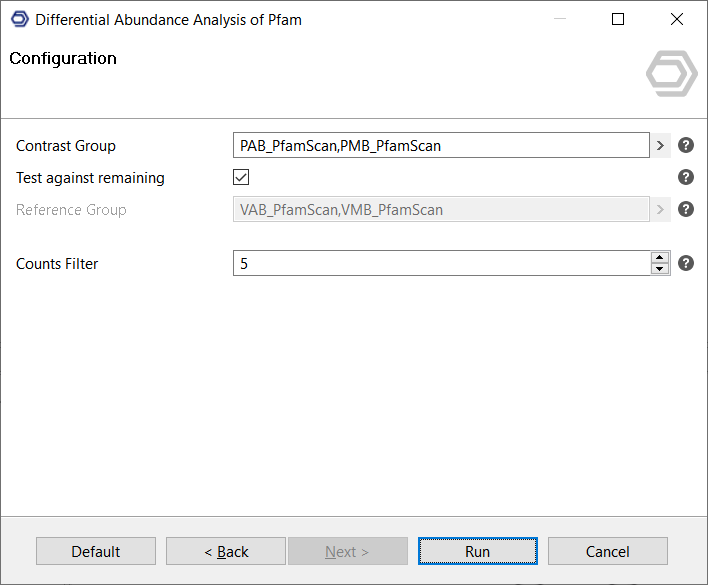
Figure 4. Functional Differential Abundance Analysis wizard: configuration page.
Results
Once the test has finished, a table with the results will open (Figure 5). Each row of this table corresponds to a specific annotation at the selected level, the items to compare option described above. Each column represents:
- Tags. Indicate if the annotation is overrepresented, tag OVER, or underrepresented, tag UNDER, in the contrast condition. Thresholds are set by default to 0.05 for FDR and 2 and -2 for FC.
- Feature and Description. The feature ID and its description.
- FC (Fold Change). The ratio between the mean abundance value of a specific annotation in the contrast condition and this value in the reference condition, if the mean abundance value in the contrast group is bigger than in the reference group. If this value is bigger in the reference group, then the FC is calculated as the ratio between the mean annotation abundance value in the reference condition and the value in the contrast condition with a negative sign. By default, an annotation is defined as overrepresented if FC is above 2, and underrepresented if FC is below -2.
- LogFC. The log2 FC.
- Std.Error. The standard deviation of the coefficient point estimate in the GLM.
- P-value. The p-value for the null hypothesis of an equal number of annotations between conditions.
- FDR. A corrected p-value for multiple testing comparisons (Benjamini Y., Hochberg Y., 1995). If meeting the logFC criterion, logFC above 1 or below -1 by default, an annotation must have an FDR below 0.05 to be considered as over- or underrepresented in the contrast group.
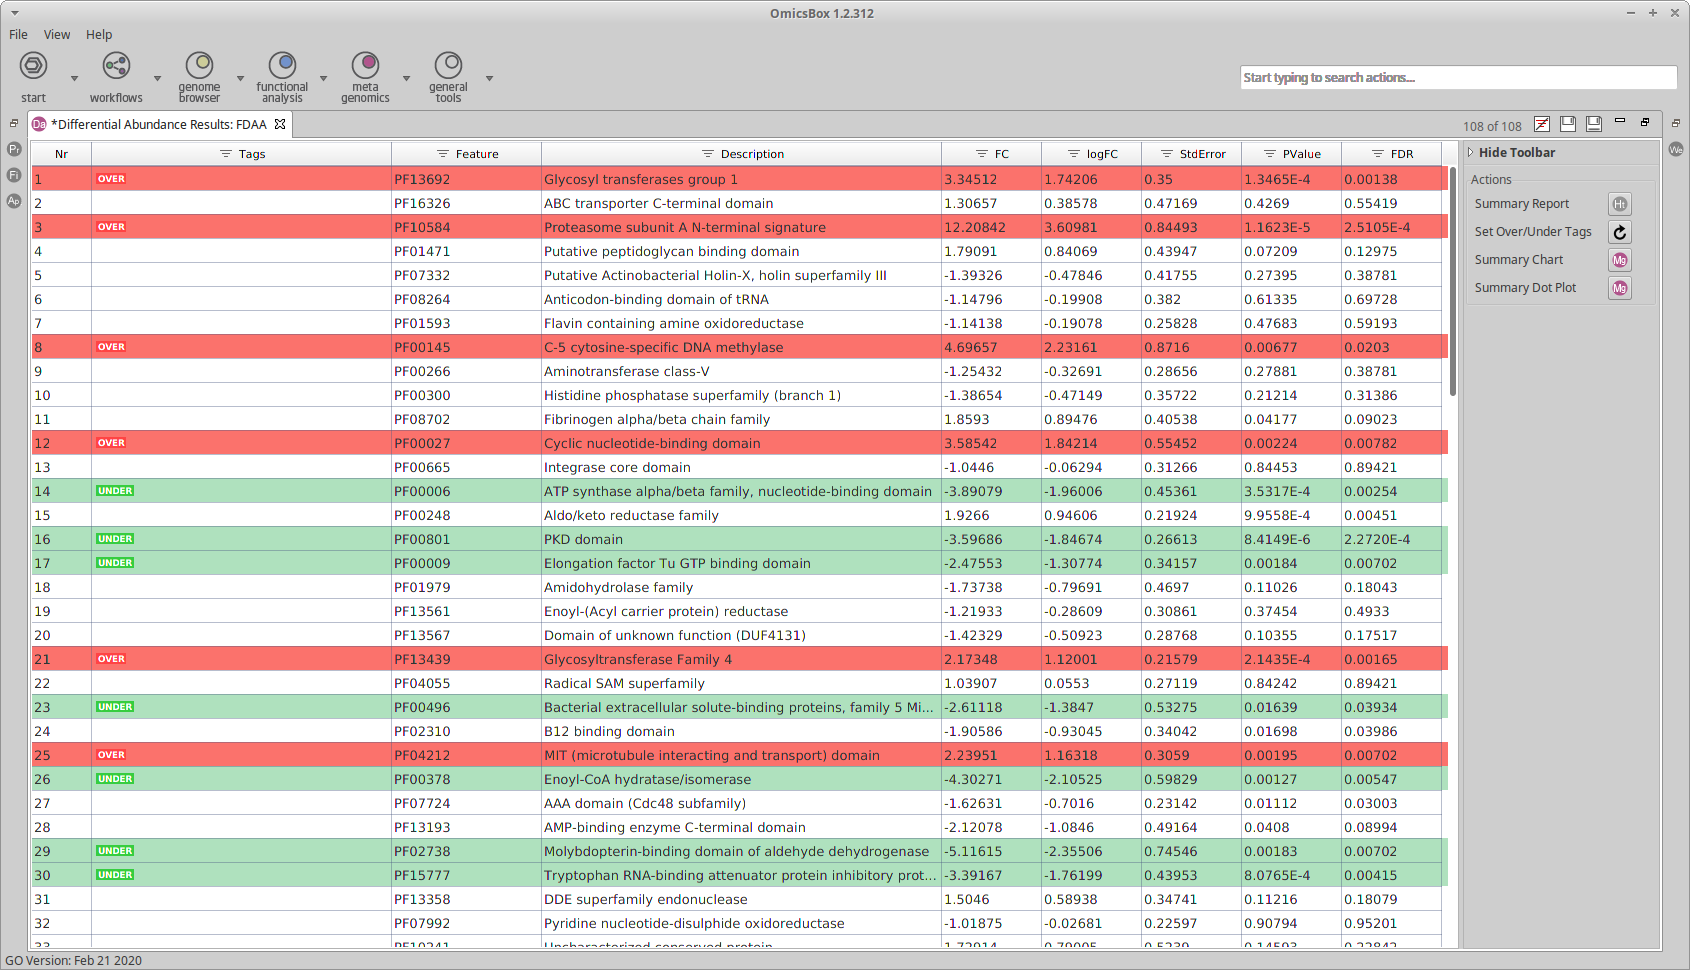
Figure 5. Functional Differential Abundance Analysis main results.
Side panel
Summary Report
Creates an HTML report which can be saved in PDF with the main results of the differential abundance test: parameters used for the test, number of enriched annotations, experimental design, and the top 10 over- and underrepresented annotations ordered by logFC and FDR (Figure 6).
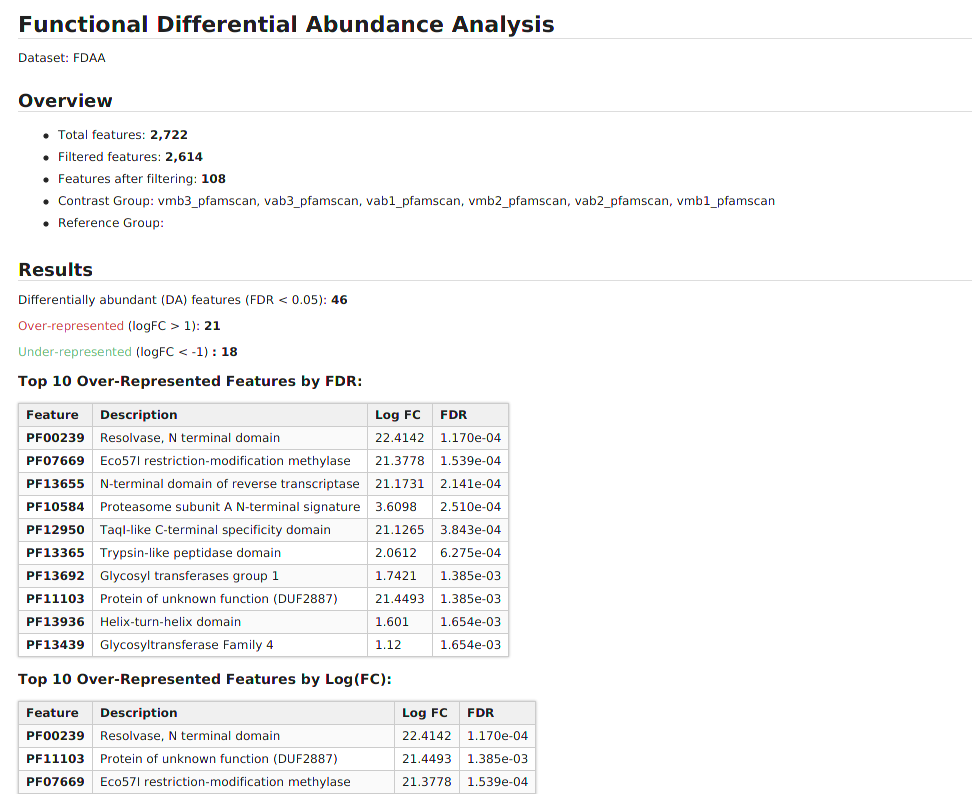
Figure 6. Functional Differential Abundance Analysis summary report.
Summary Chart
Shows a bar chart with the main results: annotations pre and post filtering steps, annotations that are considered as enriched, and the over- and underrepresented ones (Figure 7).
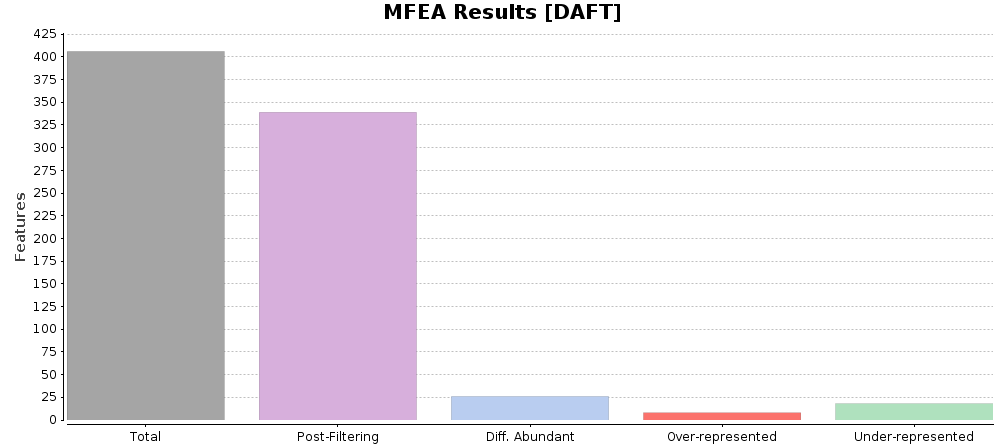
Figure 7. Functional Differential Abundance Analysis summary chart.
Set Over/Under Tags
Establish a new FDR and Fold Change cutoff to consider an annotation as significant. FDR below 0.05 and logFC below -1 or above 1 are set as default (Figure 8).
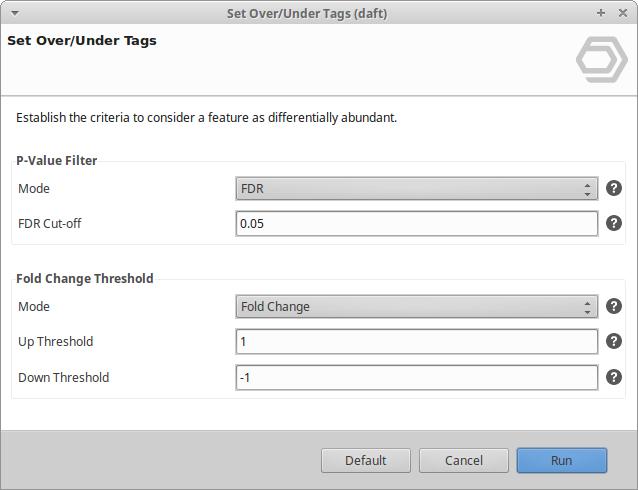
Figure 8. Set Over/Under Tags.
Summary Dot Plot
Shows a dot plot with the main results of the test (Figure 9). On the wizard page, you can select the data to include in this chart: represent the over- or the under-represented features, order them by FC or by FDR, and choose how many annotations the graph will contain, for example top 10 or top 20.
Once displayed, each row of the graph contains an enriched feature. The X-axis represents the effect size (logFC), the dot color represents the significance (FDR), and the dot size represents the number of genes in the global dataset annotated with this feature.
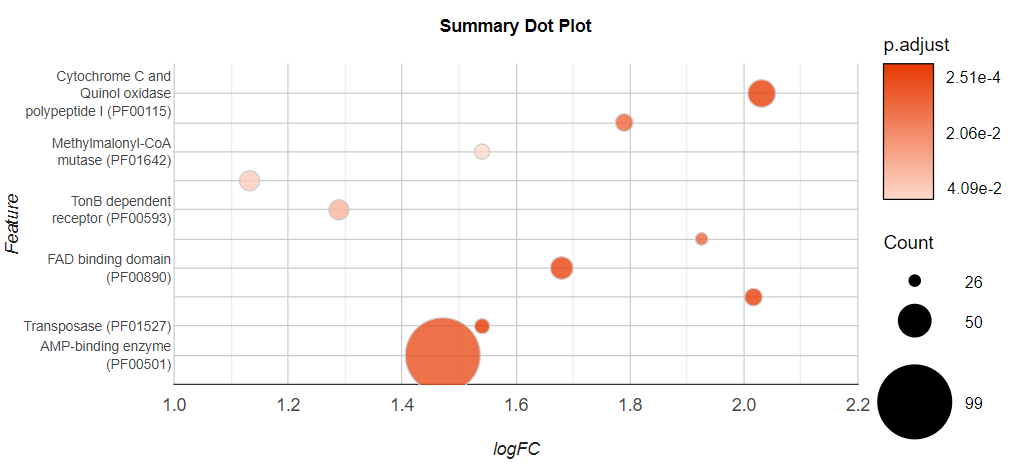
Figure 9. Functional Differential Abundance dot plot.
References
- Erik Kristiansson, Philip Hugenholtz, Daniel Dalevi, ShotgunFunctionalizeR: an R-package for functional comparison of metagenomes, Bioinformatics, Volume 25, Issue 20, 15 October 2009, Pages 2737–2738, https://doi.org/10.1093/bioinformatics/btp508
- Österlund, T., Jonsson, V. & Kristiansson, E. HirBin: high-resolution identification of differentially abundant functions in metagenomes. BMC Genomics *18,*316 (2017). doi:10.1186/s12864-017-3686-6